Server Dashboards
The FME Server Dashboards panel is used to display reports that show the general health of the FME Server installation.
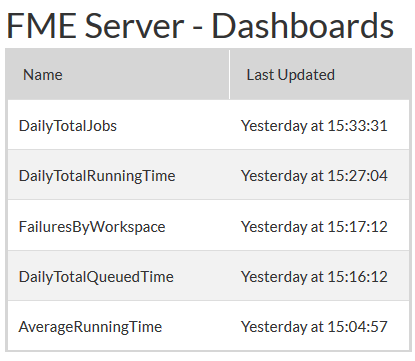
There are five default reports that exist in FME Server:

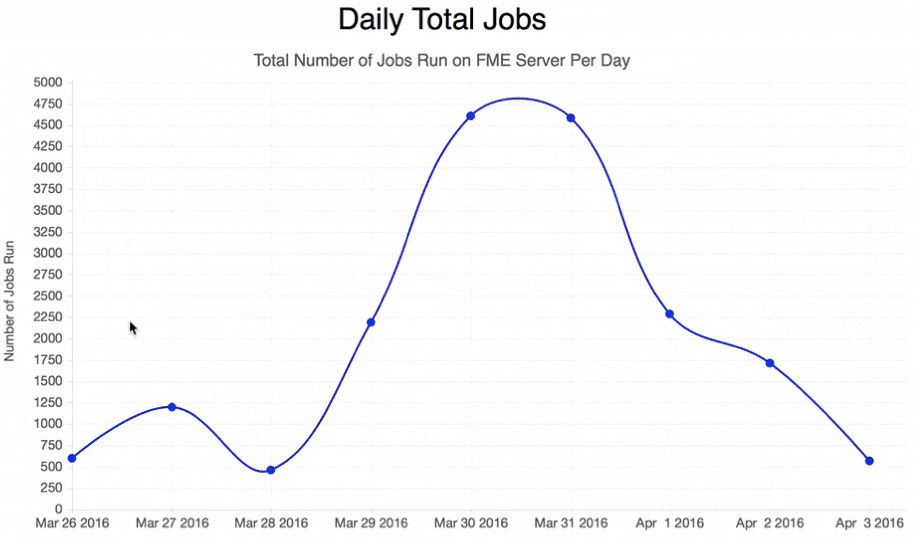
Each of these reports are simple HTML files. Clicking on a link opens that file in which a graph displaying the report information is stored:

In the above image, for example, the report shows how many jobs have been run on FME Server per day.
| Police Chief Webb-Mapp says... |
|
These reports are generated using - what else - FME workspaces! These workspaces use the HTMLReportGenerator transformer and HTML format writer to create the graphs shown in reports.
These are fairly simple workspaces and it is entirely possible to create your own reports - preferably by using an existing report as a template workspace. The Dashboards documentation explains how, but - in brief - any HTML document that is written to the folder resources\dashboards\dashboards will appear as a report in the Dashboards panel of the server web interface. |
Generating and Using Reports
The reports in the dashboard panel are not generated and/or updated by default. To have them appear - and be updated - you must carry out the following steps:
- In the FME Server web interface, click Run Workspaces and choose the Dashboards repository.
- Run the workspace JobHistoryStatisticsGathering.fmw to generate updated statistics.
- Return to Run Workspaces and choose the Dashboards repository again.
- Run the workspace for the report you wish to add/update; for example DailyTotalJobs.fmw.
- Click Dashboards.
- Click on the chosen report to see the latest statistics.
The workspace JobHistoryStatisticsGathering.fmw is also set up to run on a schedule. The schedule is called DashboardStatisticsGathering, runs every 24 hours, and is set to Disabled by default. Therefore to get daily statistics - automatically - requires this schedule to be first enabled.