| Exercise 1 | Cell Phone Signal Processing |
| Data | City Neighborhoods (Google KML) Cell Phone Signals (CSV) |
| Overall Goal | Analyze and improve the workspace performance |
| Demonstrates | Interpreting an FME log file |
| Start Workspace | C:\FMEData2016\Workspaces\DesktopAdvanced\Performance-Ex1-Begin.fmw C:\FMEData2016\Workspaces\DesktopAdvanced\Performance-Ex1-Begin-Logfile.log |
| End Workspace | None |
A close friend and fellow FME user works for a cell phone company. His current FME project is to analyze cell phone signals.
His source dataset contains a series of recordings that show how strong the cell signal is at different locations.
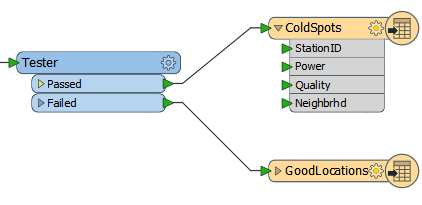
The project is to filter out locations that receive a really poor signal, tag them with the neighborhood they belong to – to show which neighborhoods have poor coverage – and write the rest of the data out as a series of attribute-less data points.
He has created a prototype workspace that processes the data and produces the correct results.
However, the workspace runs perhaps a little slower than it could, which is bad news when this is just the prototype and he wishes to eventually run it on the entire country’s cell data.
He asks for our help and sends us his workspace, the log file, and the source datasets. First of all let’s check the workspace and deconstruct its log to find out what is happening.
1) Start Workbench
Open the workspace C:\FMEData2016\Workspaces\DesktopAdvanced\Performance-Ex1-Begin.fmw
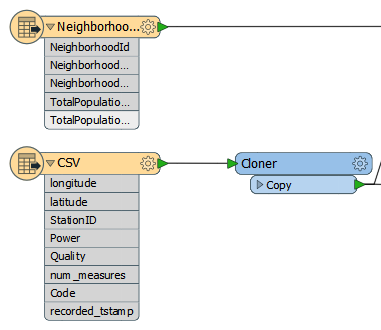
Notice there are two key feature types: one for the cell signals in CSV format, the other for the Neighborhood boundaries in KML format. They each have their own set of attributes:
| Jake Speedie says… |
| The Cloner transformer is there to increase the amount of data so that improvements to the workspace are more visible. You can also use the Number of Copies parameter to increase/reduce the amount of data to suit your computer, which may be faster/slower than the one used here. Otherwise, just pretend it isn't there! |
| .1 UPDATE |
| The Cloner transformer in this exercise gained a <Rejected> port in FME2016.1 |
There are three additional transformers:
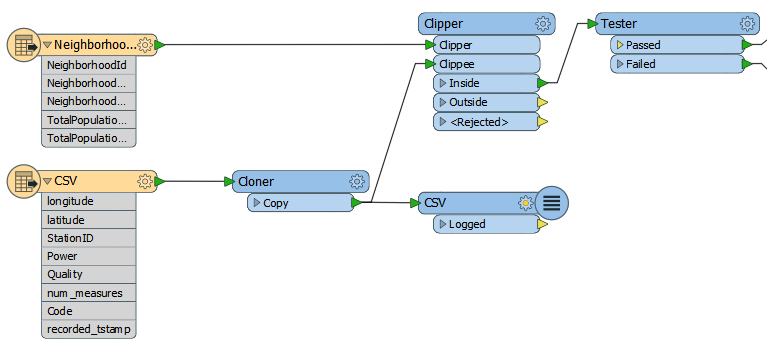
The Clipper is used to copy the neighborhood name onto each reading, and the Tester is used to filter out cell signals that are below strength. The Logger is recording cell signals to the log window/file.
Finally there are two Writers, each with a single feature type:
Don’t run the workspace yet – we don’t know how long it might take!
2) Open Log File
Besides the workspace we also have a copy of the log file, so start up a text editor and open up the log for inspection. You can find it at: C:\FMEData2016\Workspaces\DesktopAdvanced\Performance-Ex1-Begin-Logfile.log
Let’s look for some of the indicators as to how this workspace is performing.
Firstly the configuration section tells us that the user is working with FME2016 with a fixed license, Smallworld Edition.
INFORM|FME 2016.0.1.0 (20160130 - Build 16174 - WIN32)
INFORM|FME_HOME is 'C:\apps\FME2016.0\'
INFORM|FME Desktop Smallworld Edition
This is the release version of FME2016.0. Looking on the Safe web site I can see there is a newer update to that (FME 2016.0.1.1, build 16177). There might be a performance improvement in there (we could check the What's New file to see) but there's unlikely to be much advantage to upgrading; certainly not as much as if the user was using FME2011, for example.
Now look for the more important performance indicators:
INFORM|System Status: 70.52 GB of disk space available in the FME temporary folder (C:\Users\imark\AppData\Local\Temp)
INFORM|System Status: 4.00 GB of virtual memory available
INFORM|Operating System: Microsoft Windows 7 64-bit Service Pack 1 (Build 7601)
INFORM|FME Platform: WIN32
INFORM|Locale: en_CA
INFORM|Code Page: 1252  (ANSI - Latin I)
INFORM|FME Configuration: Process limits are 24.00 GB of physical memory and 4.00 GB of address space
INFORM|FME Configuration: Start freeing memory when process usage exceeds 2.83 GB of memory or 3.41 GB of address space
INFORM|FME Configuration: Stop freeing memory when process usage is below 2.12 GB of memory and 2.56 GB of address space
There is adequate of disk space and plenty of memory. The workspace is being run on a 64-bit platform but only using 32-bit FME, which is a bit disappointing as there is 25 GB of memory.
Let’s skip to the foot of the log now and see how long it took to run and how much memory was consumed at the peak:
INFORM|FME Session Duration: 11 minutes 6.5 seconds. (CPU: 306.7s user, 37.8s system)
INFORM|END - ProcessID: 50764, peak process memory usage: 2966368 kB, current process memory usage: 99712 kB
One concern is that the translation took approximately 11 minutes but CPU processing is only 306 seconds (5 minutes). We're obviously losing time somewhere.
The peak memory is also worrying. It’s close to – if not above – the amount required for FME to start releasing memory and reorganizing data. In fact if we scan the log content we can find many messages of this type:
INFORM|Finished clipping 512650 / 1586910 clippees against all clippers
INFORM|ResourceManager: Optimizing Memory Usage.  Please wait...
INFORM|Finished clipping group 1 / 2
So FME had to start optimizing memory usage at multiple points. It probably resulted in some disk caching, and that might be the cause of the lost time.
3) Run Workspace
If you would like to do so, run the workspace. Obviously you can expect that it will take approximately 11 minutes to complete on the average 32-bit machine. Do your results match what occurred in the above log file?
| Jake Speedie says… |
| It's important to note that, because of different machine specifications, you may get vastly different results to this log. That's fine; the important part is the techniques used, not the exact timings. Remember you can adjust the Cloner transformer to account for differences. |
If you have access to 64-bit FME, then why not try it to see if the performance improves. Notice that there’s no problem in opening the same workspace in 32-bit and 64-bit FME. Workbench is the same; it’s just how the workspace is run that is different.
On my machine the use of 64-bit FME improves the performance considerably:
INFORM|FME Session Duration: 5 minutes 19.3 seconds. (CPU: 295.7s user, 18.7s system)
INFORM|END - ProcessID: 51788, peak process memory usage: 9973288 kB, current process memory usage: 103544 kB
Translation was SUCCESSFUL
Notice how the time used is only 50% of what it was, and the time lost to writing to the file system is reduced by a large amount. Peak memory usage has increased, indicating that 32-bit FME was being restricted by a lack of available memory.
| Jake Speedie says… |
| In case you’re interested, the cell phone power values appear to be in dBm units – which is Decibel-Milliwatts. So now you know! |
| CONGRATULATIONS |
By completing this exercise you have learned how to:
|