Data Integration
“Getting information off the Internet is like taking a drink from a firehose.”
-- Mitchell Kapor, co-founder of Lotus and co-founder of the Electronic Frontier Foundation.
“You can have data without information, but you cannot have information without data.”
-- Daniel Keys Moran, American computer programmer and science fiction writer.
"Information is the oil of the 21st century, and analytics is the combustion engine."
-- Peter Sondergaard, Executive Vice President, Gartner, Inc.
As the quotations above illustrate, the creation, manipulation, and analysis of data represent a significant challenge for contemporary organizations. Never before has so much machine-readable data existed, but organizations still struggle to find ways to use this mass of information to aid in decision-making.
What is Data Integration?
Data integration means combining information from various sources into something useful. It’s about efficiently managing data and making it available to those who need it. Both a technical and a business process, IBM defines it as “discovery, cleansing, monitoring, transforming and delivery of data from a variety of sources.” Data integration allows the combination and analysis of data across isolated "silos" where it would normally be difficult to collaborate. It allows organizations with multiple departments, facilities, software, and workflows to bring all of their data together.
Why Do Organizations Need to Integrate Data?
Here are 9 reasons why integrating data is essential to technical and business practices.
1. Every data type has its strengths
Every data format was designed for a reason. Each one represents information in a way no other format can, with unique attributes, metadata, structure, and schema. Integrating data from different formats adds various levels of specialty to the dataset.
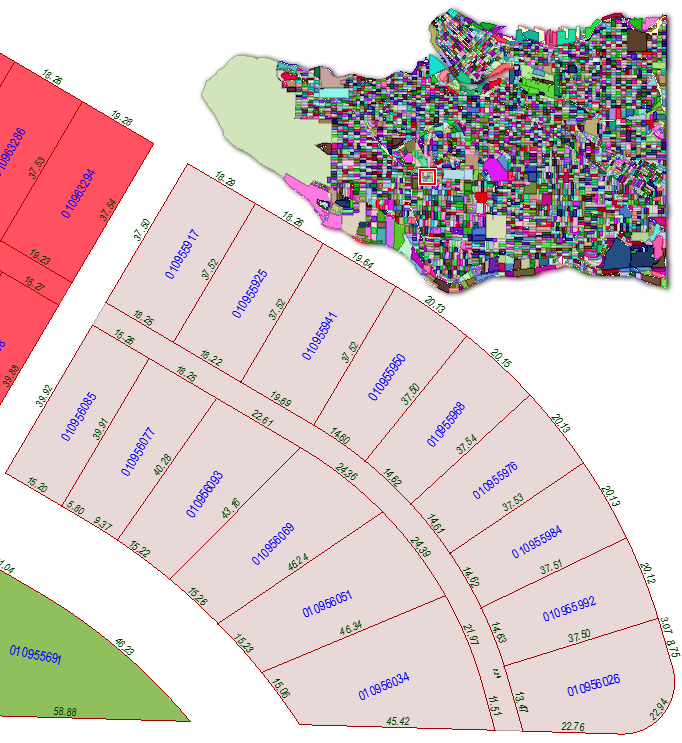
For instance, CAD and GIS data can be integrated to enhance a CAD drawing with specialized GIS information and attributes. The Culpeper Online GIS Mapping System is one example of a CAD-GIS data integration project.
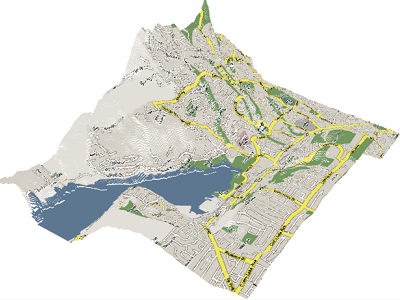
This dataset is the result of integrated raster and point cloud information, and offers the best of both worlds.
2. Take advantage of specialized applications
Similarly, every application was designed for a reason. Every piece of software that works with data represents, analyzes, and transforms information in a specialized way. By integrating data into a format accepted by that application, you’re giving yourself the power to open and use your data in that software.
For example, Cambian Business Services maintains data models from 60 different sources and at least 10 applications. They needed to integrate all of that data into a PostgreSQL database, then redeploy it to the original system. Data integration enables them to freely convert between formats and open their data in its original legacy application. (Read more about the Cambian Business Services data integration project.)
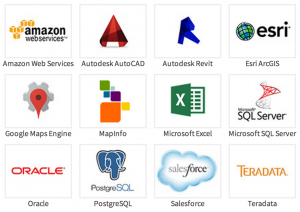
These are just a handful of popular applications that handle data in highly specialized ways.
3. Reduce data complexity
April Reeve describes it well::
The number of potential interfaces between applications in an organization is an exponential function of the number of applications. Thus, an organization with one thousand applications could have as many as half a million interfaces…
Data integration is about managing complexity, streamlining connections, and making it easy to deliver data to any system. This might involve creating a data hub that’s easy to publish to and subscribe to.
For example, Shell Canada unifies complex 2D, 3D, raster, and vector information into an easily readable 3D PDF dataset. Their data integration plan gets information to users that might not have access to specialized GIS software. (Read more about Shell Canada’s 3D PDF data integration.)
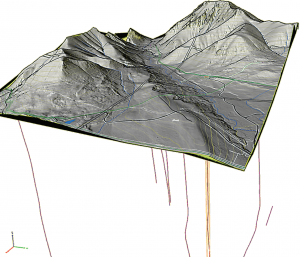
A data integration solution simplifies the interaction between diverse systems, like in this 3D PDF.
4. Increase the value of data through unified systems
Bringing disparate datasets together increases the value of the information. Examples include:
- merging with and leveraging external data (e.g. from vendors);
- combining data of varying natures (structured, unstructured, spatial, spreadsheet, web, raster, big data, etc.);
- applying spatial information to non-spatial data;
- combining databases from different repositories;
- creating a uniform schema for a group of datasets without metadata standards;
- bringing collections of data from different sources into the common GML structure for compliance with INSPIRE (see examples).
Talisman Energy, for example, integrates disparate datasets into a central GIS repository. The datasets are often not joined to GIS geometry, have a rigorous updating schedule, and may come from internal or external sources. For them, data integration is essential for efficient visualization and unified data access. (Read about Talisman Energy’s integrated GIS database.)

This comprehensive representation of a project is the result of integrating various spatial, non-spatial, and web-based sources.
5. Make data more available
Centralizing your data makes it easy for anyone at your organization (or outside of it, depending on your goals) to retrieve, inspect, and analyze it.
Easily accessible data means easily transformed data. People will be more likely to integrate the data into their projects, share the results, and keep the data up to date. This cycle of available data is key for innovation and knowledge-sharing.
For example, Alpine Shire Council integrates a range of complex source data from varying formats, including digital elevation models, Esri Shapefiles, and more. Calculations are applied to the integrated data to yield spatial and non-spatial results, which are made accessible in real time via an iPad app. (Read about the BAL Plan app.)
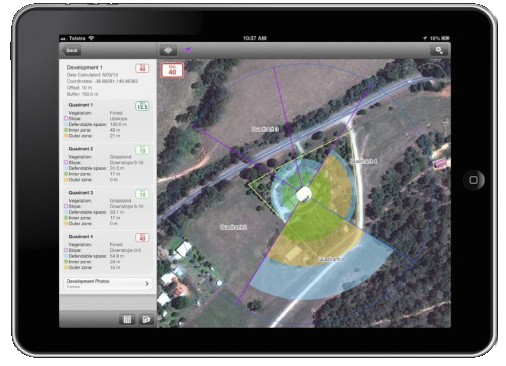
BAL Plan is an iPad app that informs users in real time about the risk of bushfires in a given area. It makes critical data publicly available and is the result of a data integration project.
6. Easy data collaboration
With accessibility comes easier collaboration. Anyone who works with your data will find it easier to use brain power now that they can actually use the data in the format they require. Whether collaboration involves sharing among internal teams and applications, or across organizations, integrated data is more complete because it has more contributors.
For example, the State of Indiana needed to combine specialized data from 92 counties in the form of points, parcels, streets with address ranges, and boundaries into an existing online GIS portal. Their data integration plan resulted in a non-invasive, easy way for all counties to collaborate on the data portal, despite each having a separate data management system. (Read about how Indiana harmonizes data in a central database.)
Data integration makes it easier to collaborate on potentially overwhelming information.
7. Understanding data means smarter business decisions
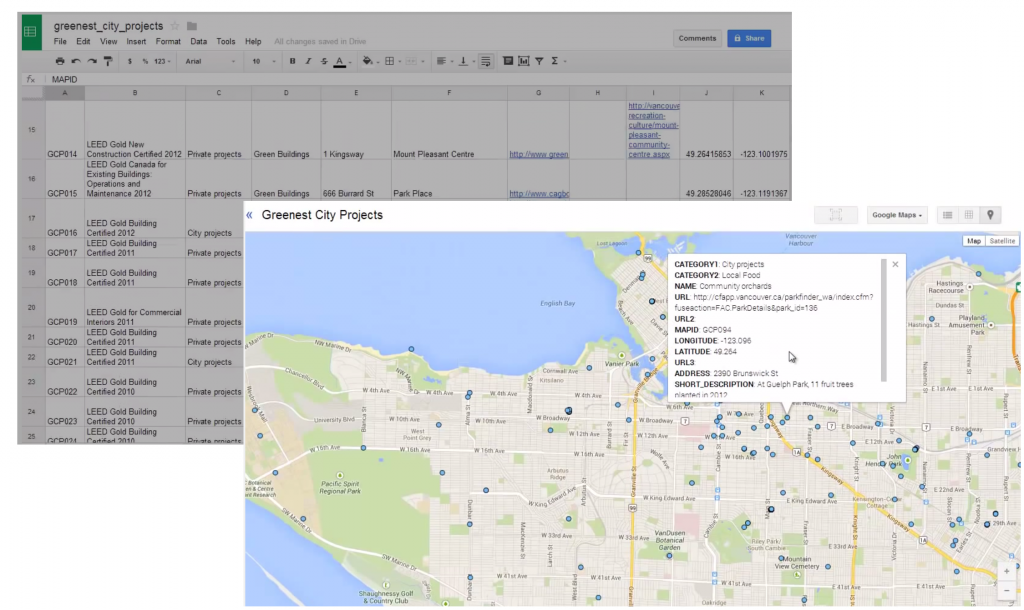
Applying location intelligence to a non-spatial dataset, like this CSV file, opens up new opportunities for decision-making.
Integrated data means transparent processes within your organization. By giving people the flexibility to use your data in whatever system, you’re giving them the opportunity to better understand the information. It’s much easier – and more informative – to navigate through organized repositories that contain a variety of integrated datasets.
Applying location intelligence to your dataset, for instance, makes it spatially comprehensive and offers new levels of insight around that dataset, which leads to better decision-making.
For example, the Skogskyrkogården data integration project combines databases, Esri Shapefiles, and JSON source data into one AutoCAD output that enables them to plan 100 years into the future.
Integrating with other data types can also mean conforming to interoperability standards to save on business costs. Further, open source data formats offer many advantages for businesses.
Applying location intelligence to a non-spatial dataset, like this CSV file, opens up new opportunities for decision-making.
8. Data integrity
Data integration technology should cleanse and validate the information passing through. Obviously, we all want our data to be robust and high quality. An integration strategy ensures data is free of errors, inconsistencies, and duplication.
For example, the BC Transit system is made up of disconnected information on bus stops, vehicles, schedules, routes and ridership, and streets. These singular systems have made central transit information vulnerable to inaccuracy. A data integration strategy ensures BC Transit’s critical data is accurate and of high quality. (Read about BC Transit’s data integration and validation process.)

These line segments have been smoothed into arcs as part of a CAD-GIS data integration strategy.
9. Make your data live
An integrated data solution makes it easy to keep information up to date. One input can propagate across all integrated systems, keeping your data current. In fact, your data can even be real-time if a server or cloud solution is part of the integration strategy.
For example, The Weather Network integrates non-spatial sensor data and metadata and outputs it to spatial applications like Google Earth or ArcGIS Earth. From there, real-time KML updates and email alerts can be leveraged. (Read about the Pelmorex Lightning Detection Network’s real-time data integration.)
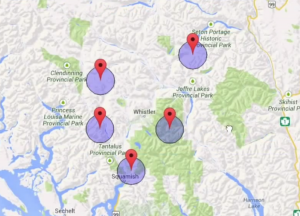
Integrating with cloud systems is one way of enjoying the benefits of live data.
Conclusion: avoiding data silos
Integrating data not only provides the benefits discussed above; it also can prevent the problem of data silos – fixed repositories of information. Like farm silos, their contents are isolated from the outside world. Did you know the feed inside a farm silo is often fermented? Did you know the air and liquid emitted during fermentation is toxic? Data trapped in silos 'ferments' and becomes useless.
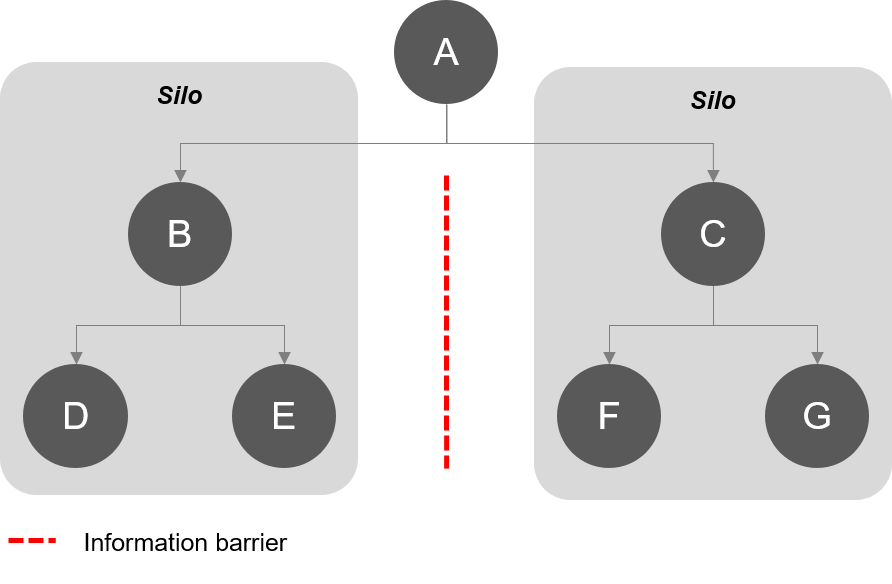 Data silos diagram by Theodoxxi (CC BY-SA 4.0, 2016).
Even if data doesn’t need to be accessed regularly, siloed data is still inefficient to work with, impossible to collaborate on, and runs a high risk of conflicting with external data. By actively integrating your data, you avoid the dreaded silo and gain the potential outlined above. Any data type can live in a wide variety of sources. Developing an integration strategy—both the technical and business aspects—is critical to ensuring your organization’s data reaches its maximum potential.
Further reading
For further reading, why not browse articles tagged with data integration on Safe Software's blog, the makers of FME.