| Exercise 3 | Basic Data Inspection |
| Data | Zoning Data (GeoJSON) Neighborhoods (Google KML) |
| Overall Goal | Inspect the output from a previous translation |
| Demonstrates | Basic data inspection with the FME Data Inspector |
| Start Workspace | None |
| End Workspace | None |
In the previous exercise, you were asked to convert some data between formats. Before you send the converted data out, you should inspect it to make sure it is correct. Let’s see how the FME Data Inspector interface works by inspecting the output from that quick translation.
1) Start FME Data Inspector
Start the FME Data Inspector by selecting it from the Windows start menu. You’ll find it under Start > FME Desktop 2018.0 > FME Data Inspector 2018.0.
2) Open Dataset
The FME Data Inspector will start up and begin with an empty view display.
To open a dataset, select File > Open Dataset from the menubar. When prompted, fill in the fields in the Select Dataset dialog as follows:
| Reader Format | GeoJSON (Geographic JavaScript Object Notation) |
| Reader Dataset | C:\FMEData2018\Output\Training\Zones.json |
NB: If you can't find the dataset - maybe you didn't complete the first exercise, or wrote the data to a different location - then you can open the original zoning dataset as described in Exercise 2.
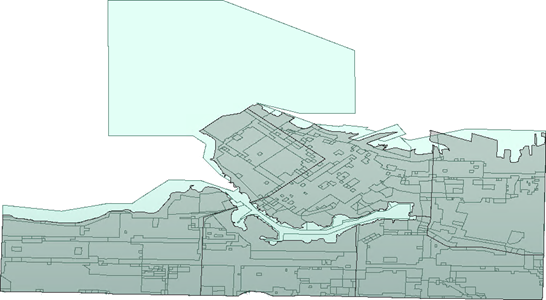
The GeoJSON dataset looks like this:

3) Browse Data
Use the windowing tools on the toolbar to browse through the dataset, inspecting it closely. Use the Query tool to query individual features and inspect the information in the Feature Information Window.
Try right-clicking in the different Data Inspector windows, to discover functionality that exists on context menus.
4) Add Dataset
Let's add a second dataset to the display to compare to our zoning data. This dataset will be a KML file of neighborhood boundaries. Then we'll be able to see which neighborhood each zone overlaps.
To add a dataset, select File > Add Dataset from the menubar. When prompted, fill in the fields in the Select Dataset dialog as follows:
| Reader Format | Google KML |
| Reader Dataset | C:\FMEData2018\Data\Boundaries\VancouverNeighborhoods.kml |
The display now looks like this:
Use the Table View to practice inspecting the tabular data for each feature type. Click on the dropdown arrow at the top of Table View and switch back and forth between the Zones.json and Neighborhoods.kml tables:

5) Set Neighborhoods Symbology
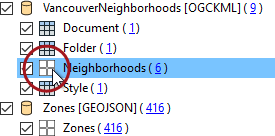
The Display Control window shows a number of different layers in the VancouverNeighborhoods dataset. In reality, most of these layers are extra information; the layer we are interested in is called Neighborhoods.
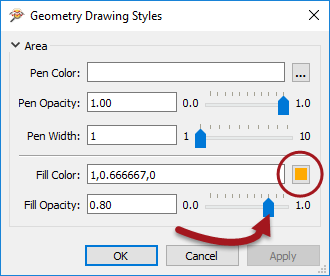
Click the symbology icon for the Neighborhoods data in the Display Control window:
Set the color to be a neutral shade (like orange) and increase the opacity value to 0.8:
6) Set Draw Order
The previous change makes it clear that the zone features are below the neighborhoods in the drawing order. To solve this problem drag the Zones dataset above the VancouverNeighborhoods dataset in the Display Control Window.
At the same time set a color for the zones data fill color and reduce the opacity value to 0.1. The main view will now look like this:

7) Set Background
When inspecting data it will help to have a background map to provide a sense of location. The FME Data Inspector is capable of displaying a backdrop from several different mapping services.
Select Tools > FME Options from the menubar. In the Background Map section, select a background map format. If you have an account with a specific provider, please feel free to use that. Otherwise, select Stamen Maps:
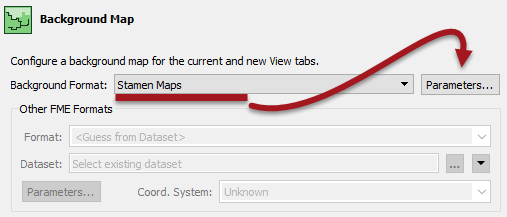
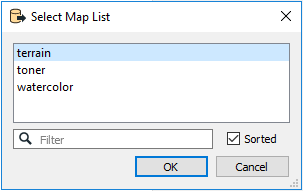
Click the Parameters button. A map constraint (type) dialog will open. Click the browse button and select "terrain":
Click OK and OK again to close these dialogs. A background map is added to the display. Notice that the data is reprojected to match the coordinate system of the chosen background. For example, the Stamen Maps background causes the data to reproject to Spherical Mercator, with a clear change of shape:
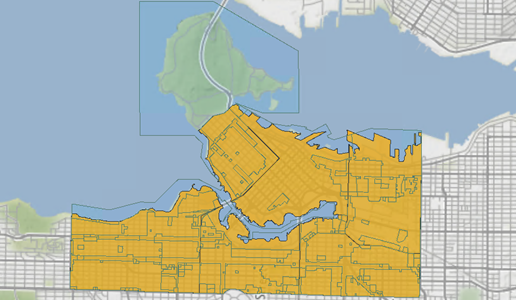
Map tiles by Stamen Design, under CC-BY-3.0. Data by OpenStreetMap, under CC-BY-SA.
| CONGRATULATIONS |
By completing this exercise you have learned how to:
|