| Exercise 3 | Basic Data Inspection |
| Data | Zoning Data (GeoJSON) Neighborhoods (Google KML) |
| Overall Goal | Inspect the output from a previous translation |
| Demonstrates | Basic data inspection with the FME Data Inspector |
| Start Workspace | None |
| End Workspace | None |
In the previous exercise, you were asked to convert some data between formats. Before you send the converted data out, you should inspect it to make sure it is correct. Let’s see how the FME Data Inspector interface works by inspecting the output from that quick translation.
1) Start FME Data Inspector
Start the FME Data Inspector by selecting it from the Windows start menu. You’ll find it under Start > FME Desktop 2018.0 > FME Data Inspector 2018.0.
2) Open Dataset
The FME Data Inspector will start up and begin with an empty view display.
To open a dataset, select File > Open Dataset from the menubar. When prompted, fill in the fields in the Select Dataset dialog as follows:
| Reader Format | GeoJSON (Geographic JavaScript Object Notation) |
| Reader Dataset | C:\FMEData2018\Output\Training\Zones.json |
NB: If you can't find the dataset - maybe you didn't complete the first exercise, or wrote the data to a different location - then you can open the original zoning dataset as described in Exercise 2.
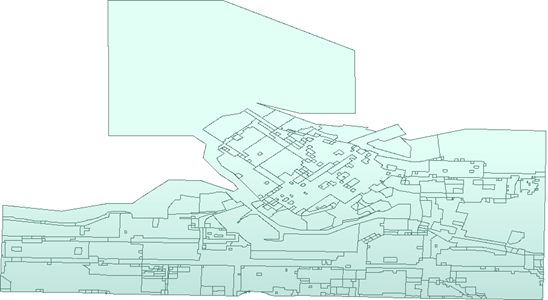
The GeoJSON dataset looks like this:
3) Browse Data
Use the windowing tools on the toolbar to browse through the dataset, inspecting it closely. Use the Query tool to query individual features and inspect the information in the Feature Information Window.
Try right-clicking in the different Data Inspector windows, to discover functionality that exists on context menus.
4) Add Dataset
Let's add a second dataset to the display to compare to our zoning data. This dataset will be a KML file of neighborhood boundaries. Then we'll be able to see which neighborhood each zone overlaps.
To add a dataset, select File > Add Dataset from the menubar. When prompted, fill in the fields in the Select Dataset dialog as follows:
| Reader Format | Google KML |
| Reader Dataset | C:\FMEData2018\Data\Boundaries\VancouverNeighborhoods.kml |
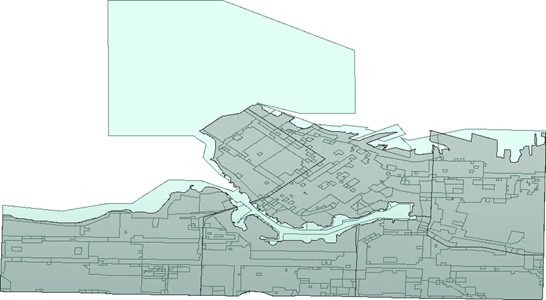
The display now looks like this:
Use the Table View to practice inspecting the tabular data for each feature type. Click on the dropdown arrow at the top of Table View and switch back and forth between the Zones.json and Neighborhoods.kml tables:

Although the layers in the View Window look confusing, we can clean up the display, as we shall find shortly.
| CONGRATULATIONS |
By completing this exercise you have learned how to:
|