| Exercise 16 | Data Visualization using Esri Maps |
| Data | None |
| Overall Goal | To demonstrate how to integrate a workspace into a Web Application and allow a user to set the parameters in the workspace based on their selection on a map. |
| Demonstrates | Esri Maps Integration, the DriveBC API, Data Streaming, and Data Visualization. |
| Completed HTML | C:\FMEData2018\Resources\RESTAPI\mySecondApp\Completed\index.html |
| Completed JavaScript | C:\FMEData2018\Resources\RESTAPI\mySecondApp\Completed\arcgismap.js |
| Completed Workspace | C:\FMEData2018\Resources\RESTAPI\mySecondApp\fme\webapp.bcroads.fmw |
| Starting HTML | C:\FMEData2018\Resources\RESTAPI\mySecondApp\www\index.html |
| Starting JavaScript | C:\FMEData2018\Resources\RESTAPI\mySecondApp\www\arcgismap.js |
In this exercise, we will be creating a website with a map that allows a user to select an area. This selection will be sent to a workspace. The workspace contains an HTTPCaller which connects to the DriveBC API. The DriveBC API has current data on any traffic incidents that may have occurred. In the workspace, the selected area will clip current accidents. The user will be sent a link with a Google Map with accidents in the selected area. This exercise is meant to demonstrate how to use other APIs in a workspace, how to integrate coordinates selected from a user into a workspace, and how to stream back data to the user.
| WARNING |
| For this exercise to work properly you will need to have completed Exercise 14 or have an existing web server for testing. |
Set Up the HTML File
In this application, we will use two separate documents. In the first application, we stored the HTML and the JavaScript in the same document and in this application we are splitting these documents into two. Many websites store their JavaScript, CSS, and HTML pages separately to promote a cleaner workflow.
1) Open the index.html document
Go to: C:\FMEData2018\Resources\RESTAPI\mySecondApp\www and find the index.html document. Once, you are in the folder right click on the index.html file and select Edit with Notepad ++.
2) Modify the Head Section in the HTML file
Review the head section of the code (lines 5-16). This head section looks very similar to one in the previous exercise. The difference is that there are a few additional lines of code:
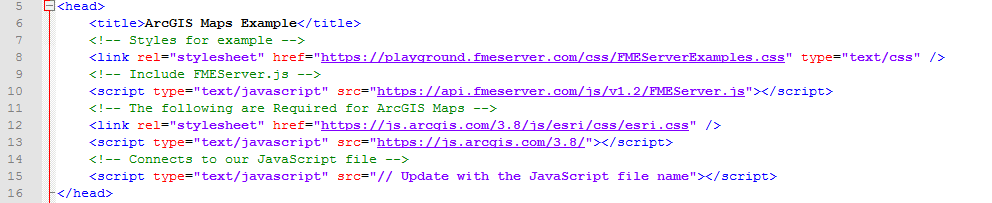
The section of code below (lines 11-13) connects to the Esri CSS. The Esri CSS adds the styling components to the map. Then, the JavaScript links to a JavaScript library made by Esri.

Line 15 links our HTML file to our JavaScript file. We need to update the src (source) parameter to the name and pathway of the file. We are changing the parameter to the name of the file indicating that the JavaScript file will be kept in the same folder as the HTML file. The JavaScript file will have to be kept in the same folder as the index.html file or the pathway will be invalid. Our javascript file will be called, arcgismap.js so the line of code will be:
<script type="text/javascript" src="arcgismap.js"></script>

We will be updating a JavaScript file to make our webpage interactive. It is a best practice to separate your JavaScript from the HTML to ensure that each file is as clean and easy to follow as possible.
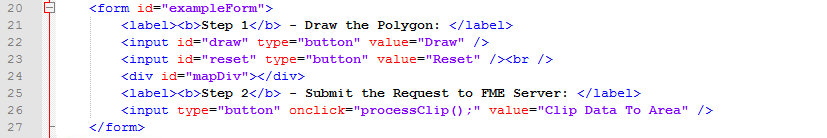
3) Review the body of the index.html file
Go to the body of the index.html file (line 18).
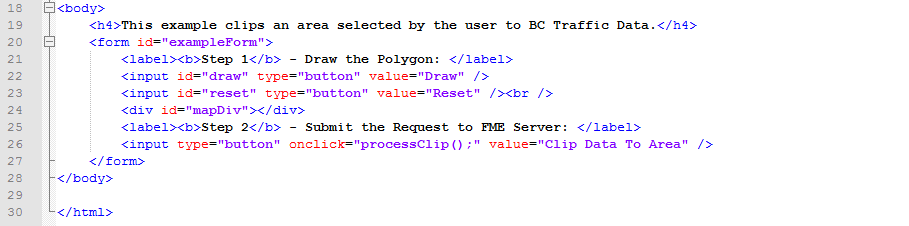
First, we have a very simple heading to explain the purpose of the application (line 19). The <h4> tag indicates that the sentence is a heading (specifically heading 4 which should be smaller than heading 2 or 3).

Then, we create a form (line 20-27), with buttons to activate different functions in the JavaScript. The draw button will allow the user to draw on the map. The reset button will reset the users drawing. The third button will use the coordinates selected from the user's drawing and clip the data to the selected area.
4) Review the components of the index.html file
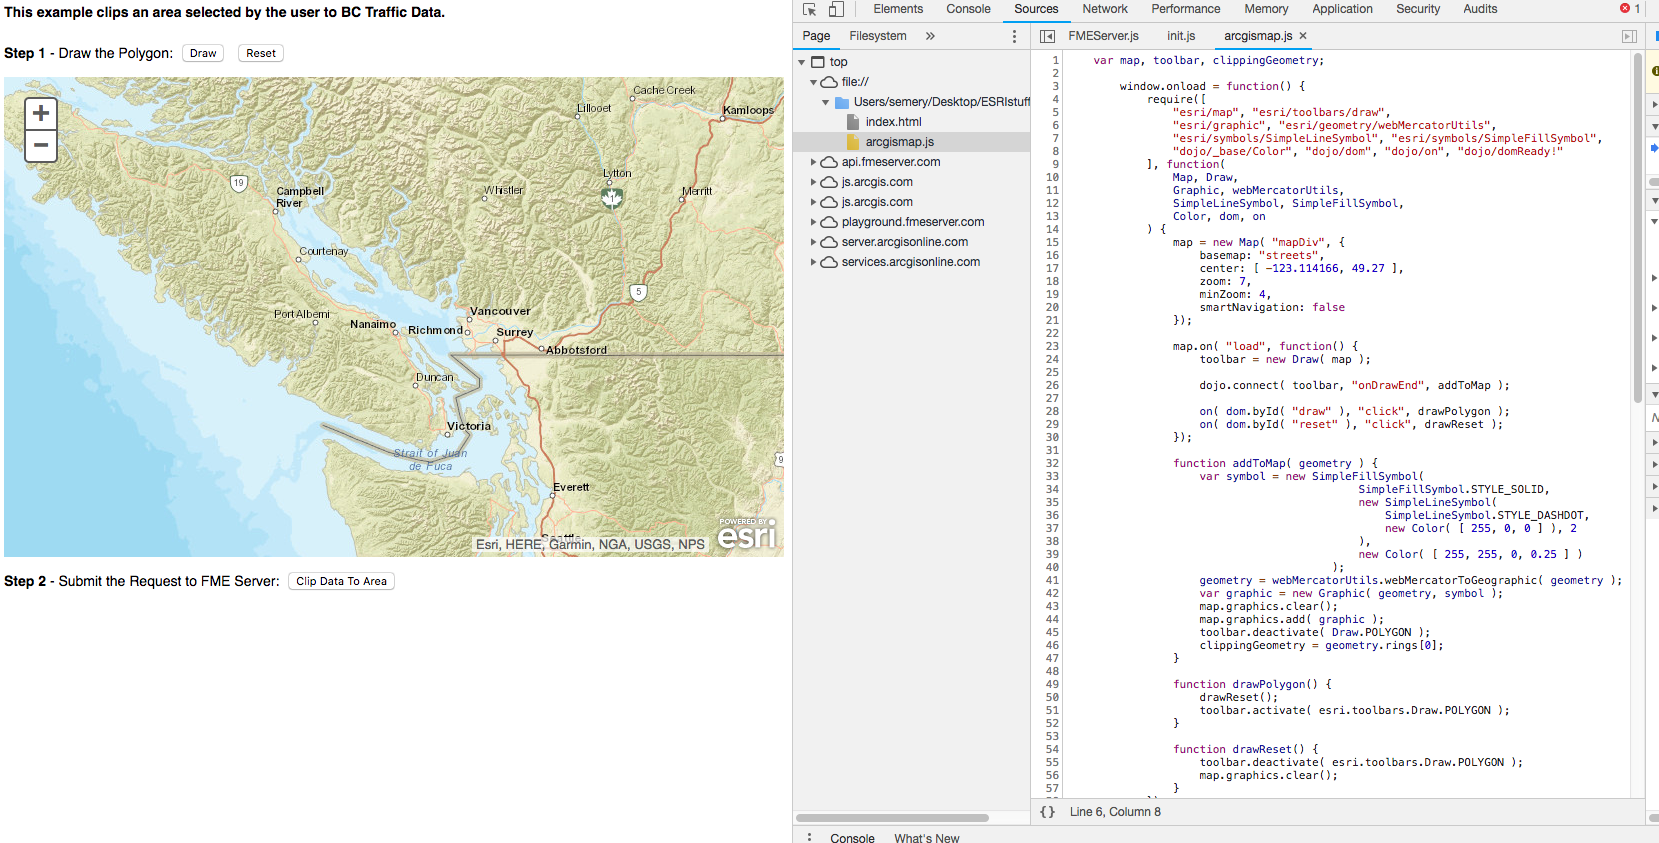
Now we are going to view our webpage on the web directly. The index file will be located here http://localhost:8000/MySecondApp/www/
Right-click, on the page and select Inspect. We should see this:
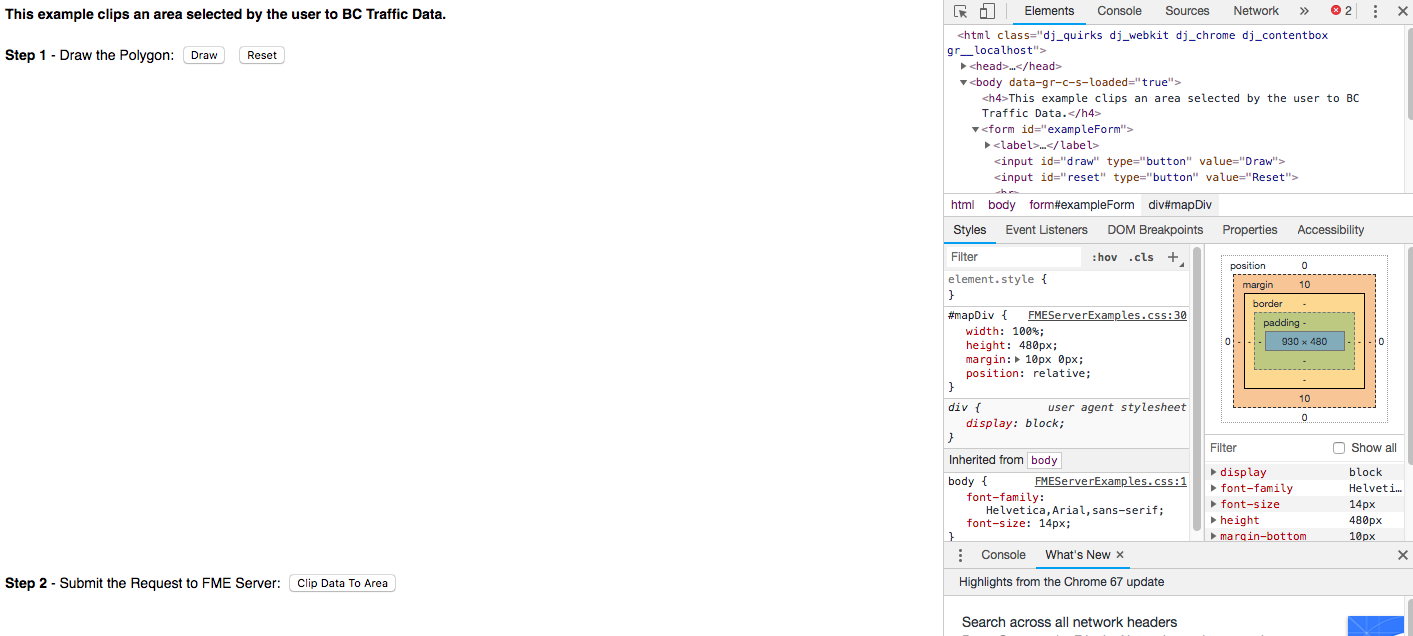
Inspecting the page will open up the developer tools which are seen on the right.
As we hover the cursor over the page, it will select different elements on the page and highlight where they exist. It will also display any errors we may have. We currently have errors because we don't have the code required to initialize the map.
To make this page effective, we need code to:
- Initialize the map
- Draw the Polygon
- Reset the Polygon
- Submit the request to the FME Server
We can now modify the JavaScript to make these functions functional!
5) Open the JavaScript File
Now, we can open the JavaScript file. Go to C:\FMEData2018\Resources\RESTAPI\mySecondApp\www and locate the arcgismap.js file right click on the file and select Edit with Notepad++.
6) Modify the code to initialize the map
On line 3, the window.onload function begins, most of this code is from the Esri JavaScript API. In this course, we won't be covering the Esri JavaScript API in much detail. To learn more about using the Esri JavaScript API visit the ArcGIS API for JavaScript Page.
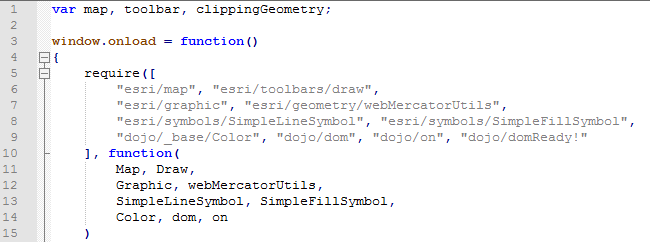
Review the first 15 lines of code of the document. The first line of code creates the variables for the map, toolbar and clipping geometry. Next on line 3, we have a function that will be activated when the window loads.
In the ArcGIS API there are many functions, objects, and classes stored in modules. These modules have to be called to use the functions listed. On lines 5-9 the modules are loaded. On lines 10-14 the code references the classes stored in the modules.
On line 17 we are using the map variable (created on line 1) to create the map object we see on screen. We are going to set four parameters on the map, these include the the basemap type, the coordinates to center the map, the default zoom level, and the minimum zoom.
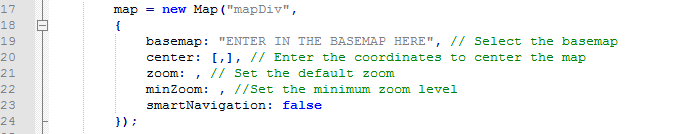
On line 19 we are going to select the streets basemap. If you'd like to view all the possible basemaps visit Esri Basemaps.
basemap: "streets", // Select the basemap
On line 20, we are going to select the center of the map using the coordinates. We are going to center the map around Vancouver, BC.
center: [-123.114166, 49.27], // Long and lat.
On line 21, we are going to set the default zoom to 7. Then, on line 22 we are going to set the minimum zoom to 4.
zoom: 7,
minZoom: 4,
The addToMap(geometry) function (line 36), is from the Esri JavaScript API. This function creates symbols that are added to the map when a user draws an area to clip. As the user selects areas on the basemap, the function will record the coordinates of the areas selected.
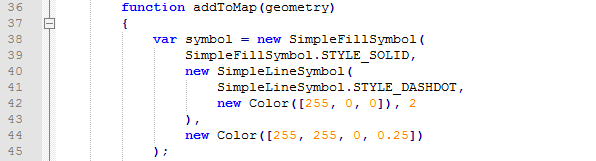
From line 38-45, we are specifying the appearance of a symbol that will be added when a user selects an area to clip.
On line 46, we are specifying which coordinate system to record the geometry in. In our case this will be Web Mercator.

From line 47-51, we are creating a graphic. A graphic is comprised of the geometry and symbol we specified on the previous lines. We then declare the clippingGeometry is the variable which will store the geometry.

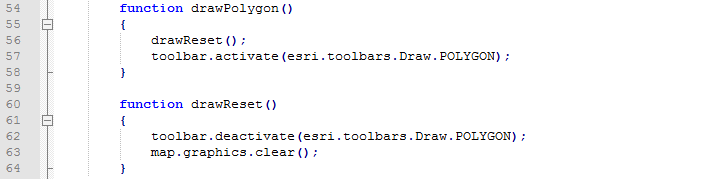
From line 54-64 we have two functions. These functions are activated when a user selects the draw or reset buttons.
7) Refresh the index.html page and test it out
This code uses the Esri JavaScript API to display a map on the page and activate the drawing and reset functions. Currently, the user can draw a bounding box on the map but this box is not used in any other functions.
8) Update the FMEServer Init function to include your FMEServer URL and token
Find the FMEServer.init (line 67-72). Use your Server Hostname and token to update the server and token section to your own. If you are on an FME training machine the URL should be http://fmetraining. If you wish to locate your token again. Go to this link:
http://<yourServerHost>/fmetoken/
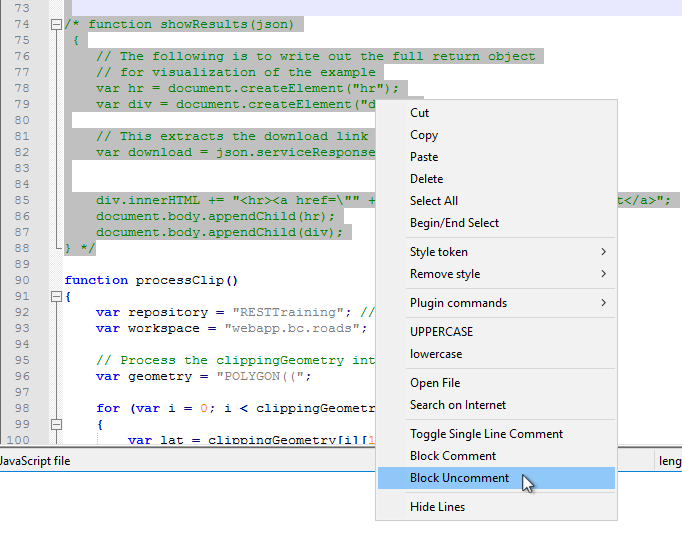
9) Uncomment the processClip Function
The processClip function (line 90-114), takes the coordinates selected by the user and formats them in a way that can be used as a published parameter.
Highlight the processClip function. Then, right click and select Block Uncomment.

First, we have not uploaded the workspace to our server, so this will not currently work but let's discuss how we could recreate these functions. Our goal with the processClip function is to set the proper parameters so we can later use the runDataDownload function.
This code can be found in the ArcGIS Maps Integration on the FME Server Playground.
To use this the DataDownload function, we need the following variables:
- Repository
- Workspace
- Parameters
- Callback
This function is located at the end of our code (line 113).

However, to be able to use this function we first need to specify the variables. We are going to begin by specifying the repository and the workspace. This is easier than the previous exercise because we can hard code this in.
The repository and workspace have to specified on lines 92 and 93 respectively. We will upload this workspace later on in the exercise. However, these values should match the actual repository and workspace values to ensure this exercise works.
We need to update var repository = "" to var repository = "RESTTraining"
We need to change var workspace = "" to var workspace = "webapp.bc.roads.fmw"
var repository = "RESTTraining"; //Enter repository name
var workspace = "webapp.bc.roads"; //Enter the workspace name
Next, we can create the parameter variable. With the workspace (created later in the exercise), we need to know all the parameters in advanced to be able to use this call.
Therefore, if you were using this call in a real situation, it is best to create the workspace first. However, the only parameter in the workspace is GEOM, which will accept Well Known Text (WKT) from our application.
Well Known Text is a format that creates a string that looks like this:
POLYGON((-123.31968482260129 49.05758039932133,-123.64927466635129 50.269944861577876,-119.33714087728879 50.34712582770931))
In JavaScript we can add bits of strings together to create the full parameter for example we can create a function:
    a="app";
    b="le";
    apple= a+b;
apple will then equal the string "apple."
This can also be done with these statements:
    a= "The REST API is ";
    a += "fun";
a will then equal "The REST API is fun".
We are going to use this method to create the parameter string needed for this call to run.
First, we start with the declaring that the input will be a Polygon.

Now, we need to input the coordinates of that were selected by the user. Earlier in the program, we specified that the clippingGeometry would contain the geometry selected by the user.
We need a function to sort through all the data in the clippingGeometry variable. For this, we will use a for loop. This loop will end when there is no more data left.
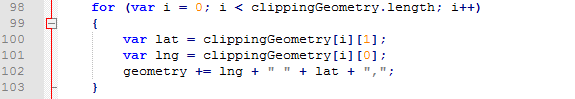
It's important to note that the index of elements in an array in JavaScript start from 0 instead of 1. The lng, we are assigning the first coordinate read, and then the lat is in the second position. Then the geometry string is added to by this statement:

This will leave us with the following statement:
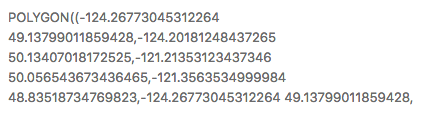
To complete the geometry string we need to remove the trailing comma and close the parentheses.

We have now created the statement for the parameters.
Each parameter you create will have a name associated with it. In our case, our parameter name will be GEOM.

Now finally, we have completed the parameters required to run the DataDownload function. We just need a function to accept the json that the DataDownload function produces, so we use the showResults function.
10) Uncomment the showResults Function
Find the showResults function (line 74-88). Then, highlight it right click and select block uncomment.
On lines 78-79 the code is creating a new div and a new divider.

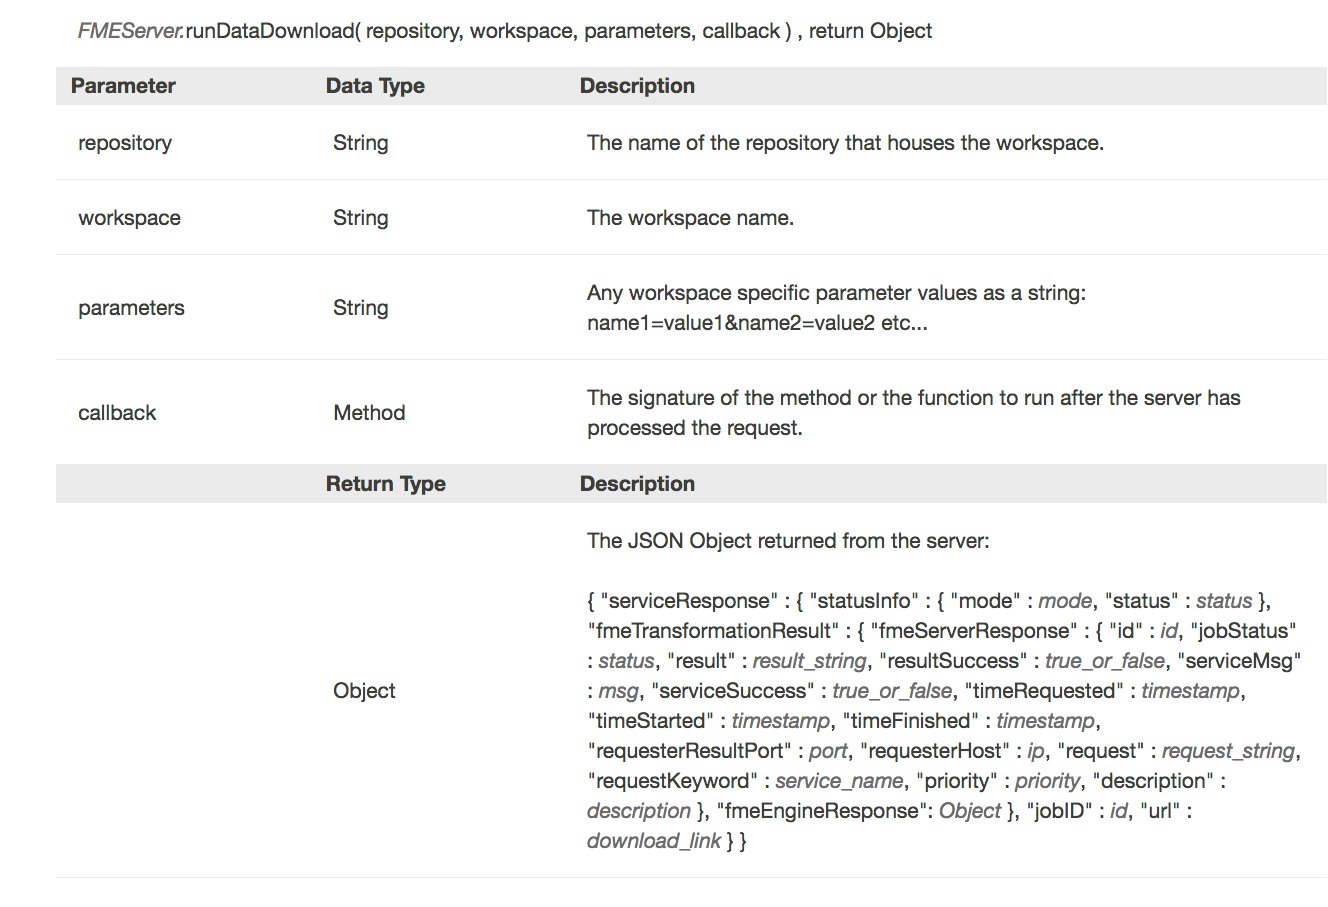
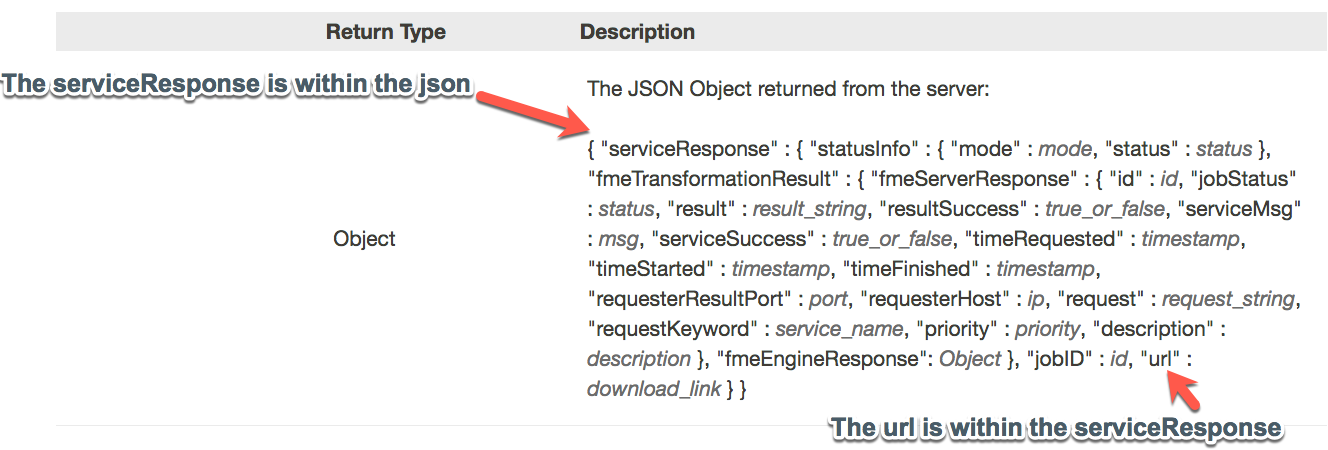
Next, the function will need to find to find the URL returned by the Server. This URL links directly to a file the user can download. In the previous exercise we used the console to find the location of the URL. However, this information is also in the FME Server JavaScript API.
Using the documentation, we can review what the JSON will look like from the FME Server:
To find the download link we use the following statement:

This is stating where the URL download link is, it is within the JSON, in the serviceResponse, and under URL. You can find this yourself here:
Now, that we have the URL, we can display the URL in a link on line 85.

We now have an application that will accept coordinates selected by a user then use the DataDownload service to return features in that area. Now we can create a workspace to use.
Create a Workspace
11) Open a blank workspace in FME Workbench and add a Creator Transformer to the workspace
12) Add the GeometryReplacer
The first step is to get the user input from the web application. If you look at this section of the code, you can see that we are setting that the code is accepting a well-known text string from the user input and placing it in a parameter called GEOM.
var params = "GEOM=" + wktString;
So, to bring this information into the workspace, we will use the GeometryReplacer. In the GeometryReplacer fill the parameters out below:
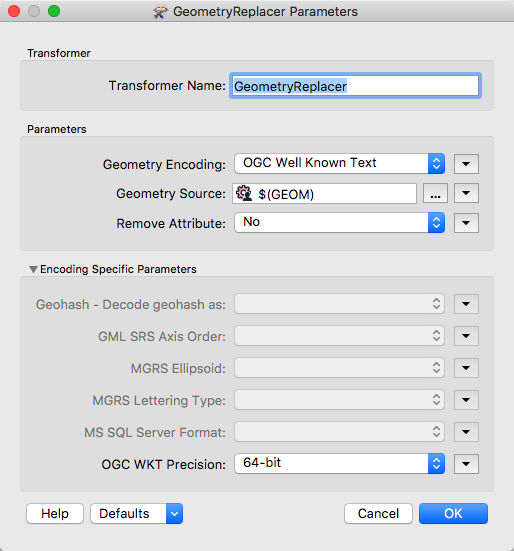
The Geometry Encoding will be set to OGC Well Known Text. This is what is returned from user selecting points on the map. The Geometry Source is a user parameter which will be created. On the geometry source click on the dropdown list, find the user parameter, then click on Create User Parameter.
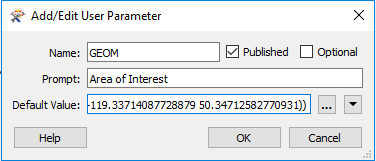
The dialog that opens allows us to create a new parameter. Create one using the following parameters:
Name: GEOM
Published: Yes
Optional: No
Prompt: Area of Interest
Default Value: POLYGON((-123.31968482260129 49.05758039932133,-123.64927466635129 50.269944861577876,-119.33714087728879 50.34712582770931))
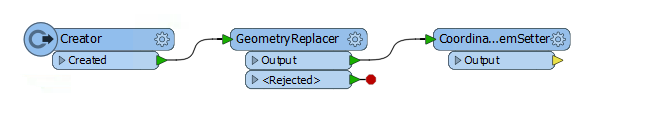
13) Add the CoordinateSystemSetter
At this point in the workspace, we have the coordinates into the system, and it has been converted to geometric features. However, there is no way for FME to know what the coordinate system is. So we are going to set it to LL84. Connect the CoordinateSystemSetter to the Output port of the GeometryReplacer.
14) Add the HTTPCaller
Add a HTTPCaller to the canvas and attach it to the Creator.
In this section we are using the Drive BC API. The Drive BC API retrieves up to date traffic information and will relay it to your map. If you wish to find the more information visit the Drive BC API website.
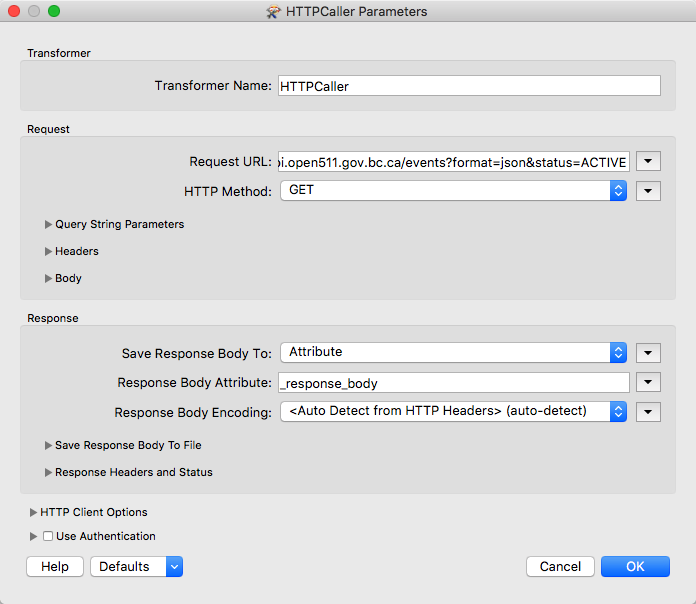
Next, we need to add the HTTPCaller to contact the Drive BC API. The Drive BC API is open to the public, so no authorization or authentication is needed. Under Request URL put:
http://api.open511.gov.bc.ca/events?format=json&status=ACTIVE
The HTTP Method is GET
The HTTPCaller Parameters should look like this:
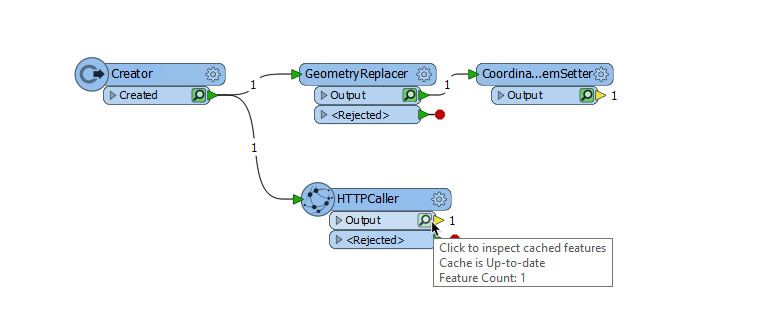
15) Run with Feature Caching
Now, we are going to test the workspace. This will ensure that the workspace is connecting to the DriveBC API. This will also let us examine what is being returned by the API.
First, save the workspace as, webapp.bcroads.fmw in the mySecondApp folder. To use feature caching click on Run in the toolbar. Then click run with feature caching.
Then, select the play button to run.
Click, on the magnifying glass on the HTTPCaller to examine the output from the REST API. The JSON returned by the API is stored within the response_body.
Within the response_body you should see should be structured in a similar way to what's below.
  {
    "events": [
        {
            "jurisdiction_url": "http://api.open511.gov.bc.ca/jurisdiction",
            "url": "http://api.open511.gov.bc.ca/events/drivebc.ca/DBC-1301",
            "id": "drivebc.ca/DBC-1301",
            "headline": "CONSTRUCTION",
            "status": "ACTIVE",
            "created": "2018-09-04T13:18:13-07:00",
            "updated": "2018-09-04T13:18:13-07:00",
            "description": "Highway 1, westbound. Paving operations planned between Exit 146 and Exit 135: Highway 9 for 11.0 km (Chilliwack). Starting today at 9:00 PM PDT until tomorrow at about 6:30 AM PDT. 28 km west of Hope between Herrling Island and Hwy 9. Last updated today at 1:18 PM PDT. (DBC-1301)",
            "+ivr_message": "Highway 1, westbound. Paving operations planned between Exit 146 and Exit 135: Highway 9 for 11.0 km (Chilliwack). Starting Tuesday, September 4 at 9:00 PM until tomorrow at about 6:30 AM. Last updated Tuesday, September 4 at 1:18 PM.",
            "schedule": {
    "intervals": [
        "2018-09-05T04:00/2018-09-05T13:30"
    ]
},
            "event_type": "CONSTRUCTION",
            "event_subtypes": [
                "ROAD_MAINTENANCE"
            ],
            "severity": "MINOR",
            "geography": {
                "type": "LineString",
                "coordinates": [
                    [
                        -121.760359,
                        49.181117
                    ],
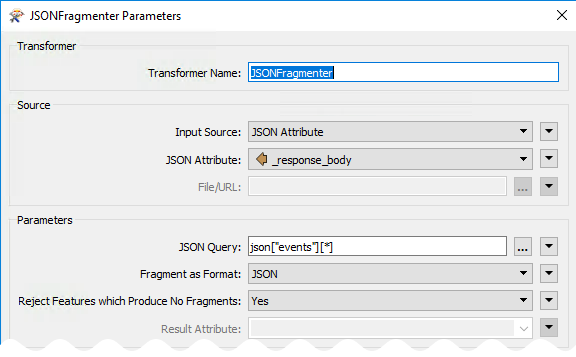
16) Add JSONFragmenter
On the canvas add a JSONFragmenter and attach it to the HTTPCaller.
The response body will be returned as a long section of JSON. We need to break this down and expose the attributes needed. This JSONFragmenter will be used to expose the attributes listed under "events" as in the above code.
Under Source fill in the parameters:
Input Source: JSON Attribute
JSON Attribute: response_body
Next move onto the Parameters section.
All the important information is stored in the category of events to gain access to it under the JSON Query write:
json["events"][*]
Fragment as Format: JSON
Reject Features which Produce No Fragments: Yes
Now we can flatten the JSON to produce the attributes needed for the table.
In the Attributes to Expose Section click on the ... and write the following attributes: status, headline, description, created, and updated.
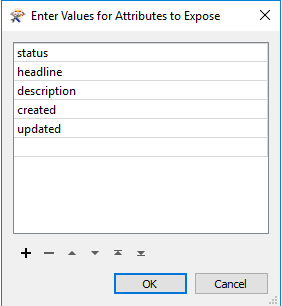
The Flattening Parameters should look like this:

17) Add another JSONFragmenter
Add another JSONFragmenter to the canvas and attach it to the previous JSONFragmenter. Now, we need to expose the Geography component to create features.
Fill in the following parameters:
Input Source: JSON Attribute
JSON Attribute: response_body
Next, move onto the Parameters section.
JSON Query: json["geography"]
Fragment as Format: JSON
Reject Features which Produce No Fragments: Yes
Finally, more onto the Flattening Parameters.
Flatten Query Result into Attributes: No

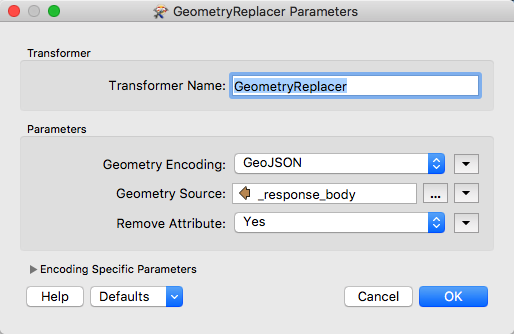
18) Add a GeometryReplacer
Add a GeometeryReplacer and attach it to the second JSONFragmenter.
The GeometeryReplacer is an amazing transformer. It can read the JSON from the Response Body and will automatically create the geometry associated with it.
Fill in the following parameters:
Geometry Encoding: GeoJSON
Geometry Source: response_body
Remove Attribute: Yes
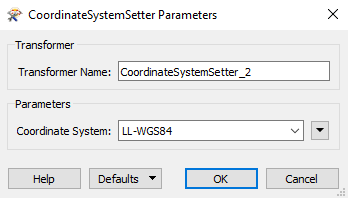
19) Add the CoordinateSystemSetter
Add a CoordinateSystemSetter and attach it to the GeometryReplacer.
Now, we need to set the coordinate system used. The coordinate system is referenced in URL returned by the call. So we can set it to LL-WGS84.
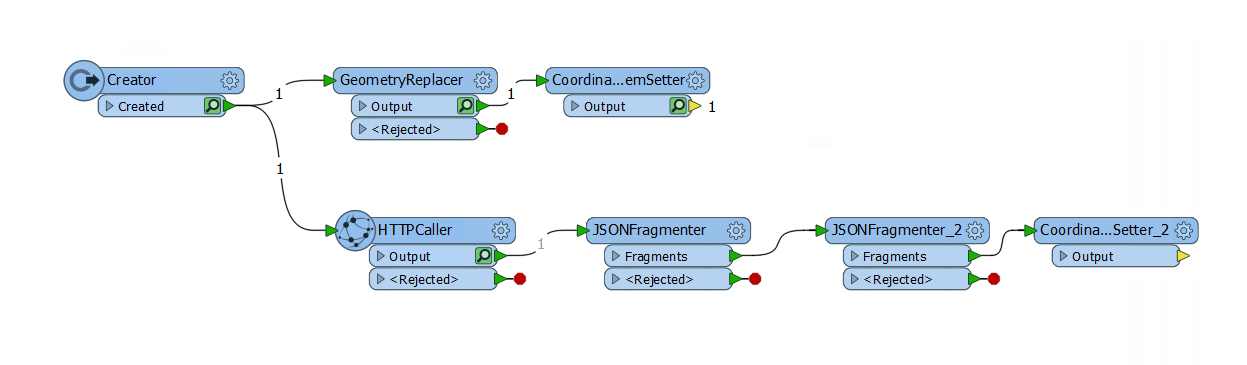
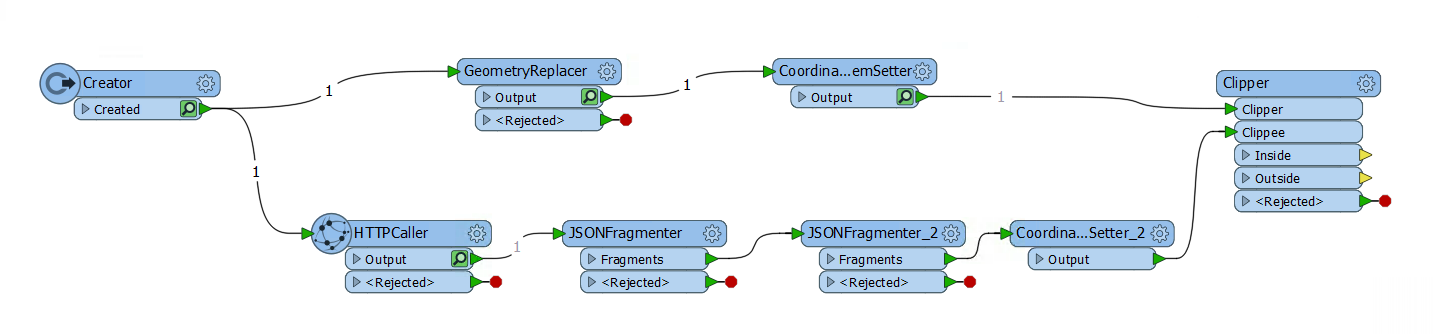
Currently, the workspace should look like this:
20) Add the Clipper Transformer
Add a Clipper Transformer to the canvas and accept the current defaults.
Now we are going to use the Clipper transformer to clip the area selected area. The clipper is the area selected by the user, and the clippee is the geometry from the BC Drive API.
The workspace should look like this:
21) Run with Feature Caching
Now, we are going to test the workspace. This will ensure that the workspace is working and clip the correct area.
Select the play button to run.
Click, on the magnifying glass on the Inside port on the clipper to view the area selected.
This will open the FME Data Inspector.
The FME Data Inspector will display the points and lines created. To display the background map go to the top menu bar. Find Tools, select FME Options. This will open the FME Options window.
Background Format should be changed from None to Stamen Maps. Then, select Parameters...
Select, the terrain map list. Select OK. Then, in the FME Options window select OK. This will activate the background map.
All the results should be in BC. After exploring the features returned close the Data Inspector. Then, return to FME Workbench.
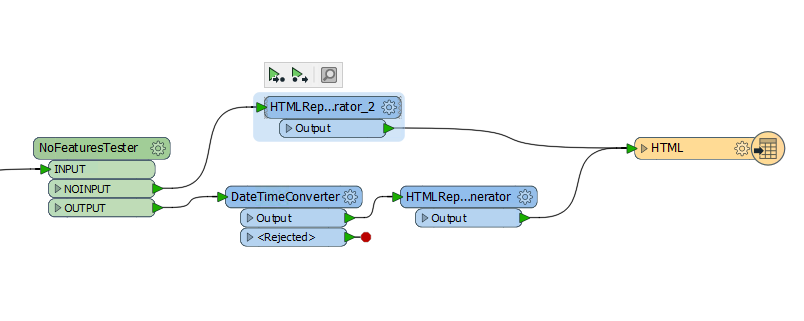
22) Add the NoFeaturesTester
Start typing NoFeaturesTester in FME Workbench and select the custom transformer. The NoFeaturesTester should be attached the Inside port of the Clipper. This transformer will test if there was an output or not. If there is no input, this means all the features were outside or rejected.
23) Add the DateTimeConverter
Add a DateTimeConverter and attach it to the OUTPUT port of the NoFeaturesTester. The DateTimeConverter is used to update the time and date, so it is more readable for the user.
Fill in the following parameters:
Datetime Attributes: updated created
Input Format: Auto detect FME and ISO formats
Output Format: %Y:%m:%d %H:%M:%S (Exif datetime)
Repair Overflow: No

24) Add the HTMLReportGenerator
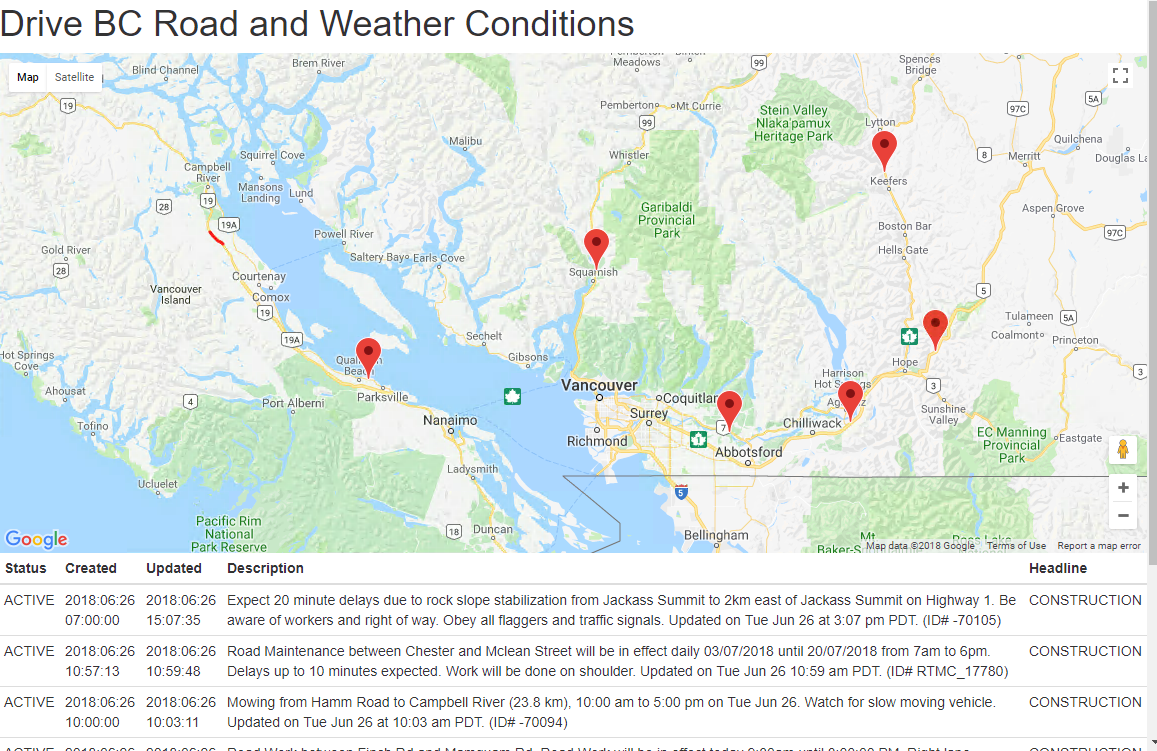
Add the HTMLReportGenerator and attach it to the DateTimeConverter. Now, we are ready to create a webpage with the following information. We need three sections, a title, a map, and a table.
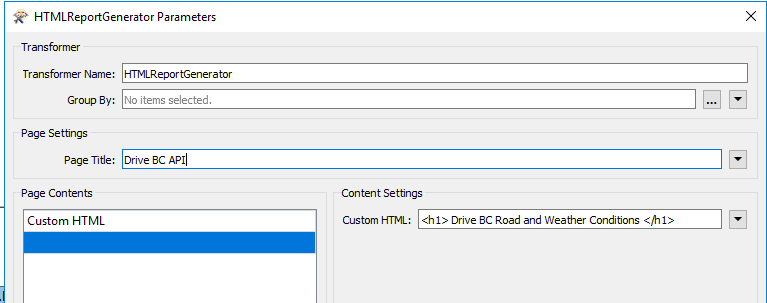
Under Page Settings find the Page Title box. The Page Title should be Drive BC API.
Then, create the title. Under Page Contents select Custom HTML. Under Content Settings copy and paste the following:
<h1> Drive BC Road and Weather Conditions </h1>
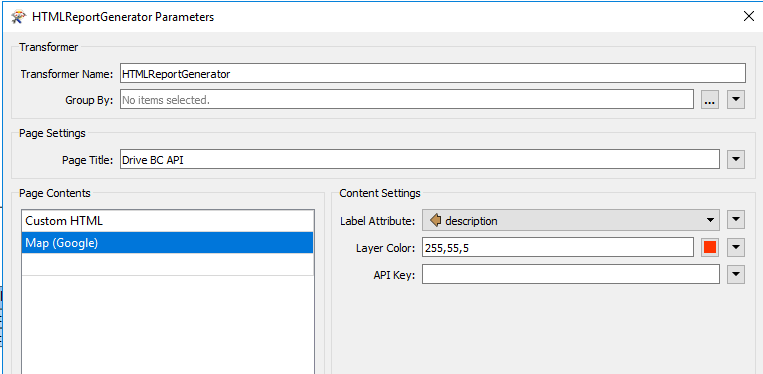
Next, we will add a Map Component. The Page Contents should be Map(Google). Then, the Content Settings should be set up as follows:
Label Attribute: description
Layer Color: 255,55,5
API Key: << blank >>
For now, we are not going to fill in the API key. As this is for development purposes this is okay. If you want to use this in a production setting you would require an API key.
If you wish to obtain an API key, visit this website, Google API Key
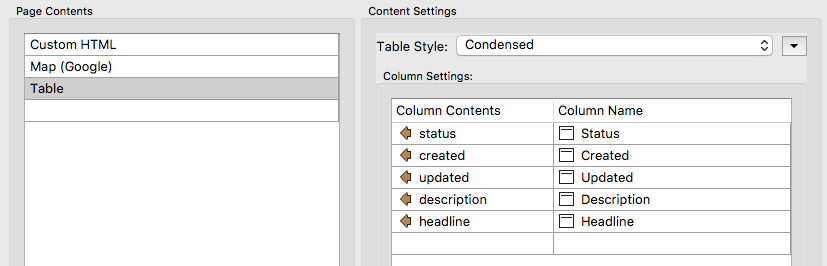
Next, create a table with the status, created, updated, description, and headline columns.
25) Add another HTMLReportGenerator
Add another HTMLReportGenerator and attach it to the NOINPUT port of the NoFeaturesTester.
In the Page Title box write:
Drive BC API
Under Page Contents select the Header. Then, under Content Settings write:
There are no incidents in the area you selected.
26) Add the HTML Writer
Finally, add in the HTML writer to write to a file of your choice. Attach the HTML writer to both HTMLReportGenerators.
The full workspace should look like this:
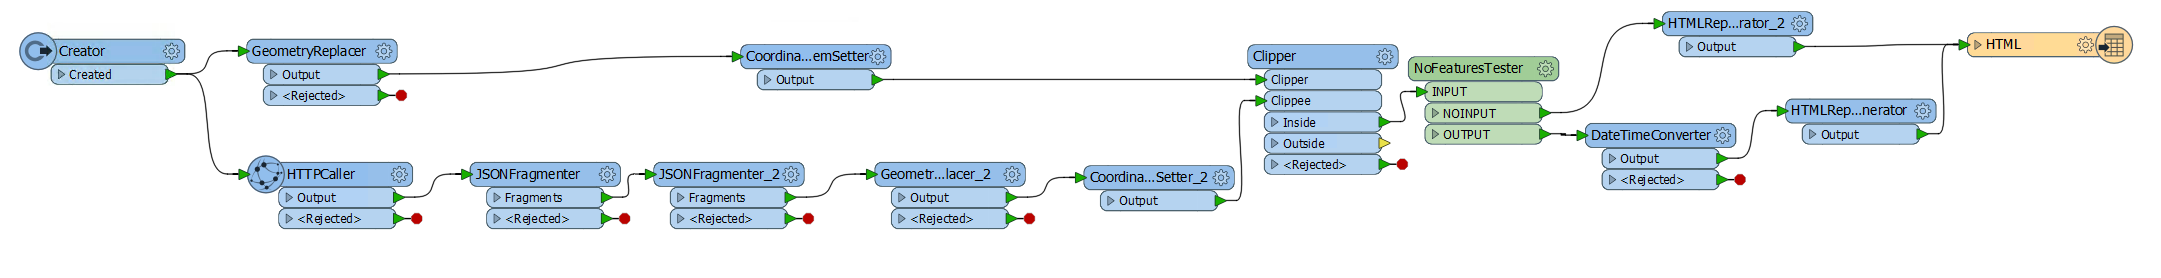
27) Save and Run the Workspace
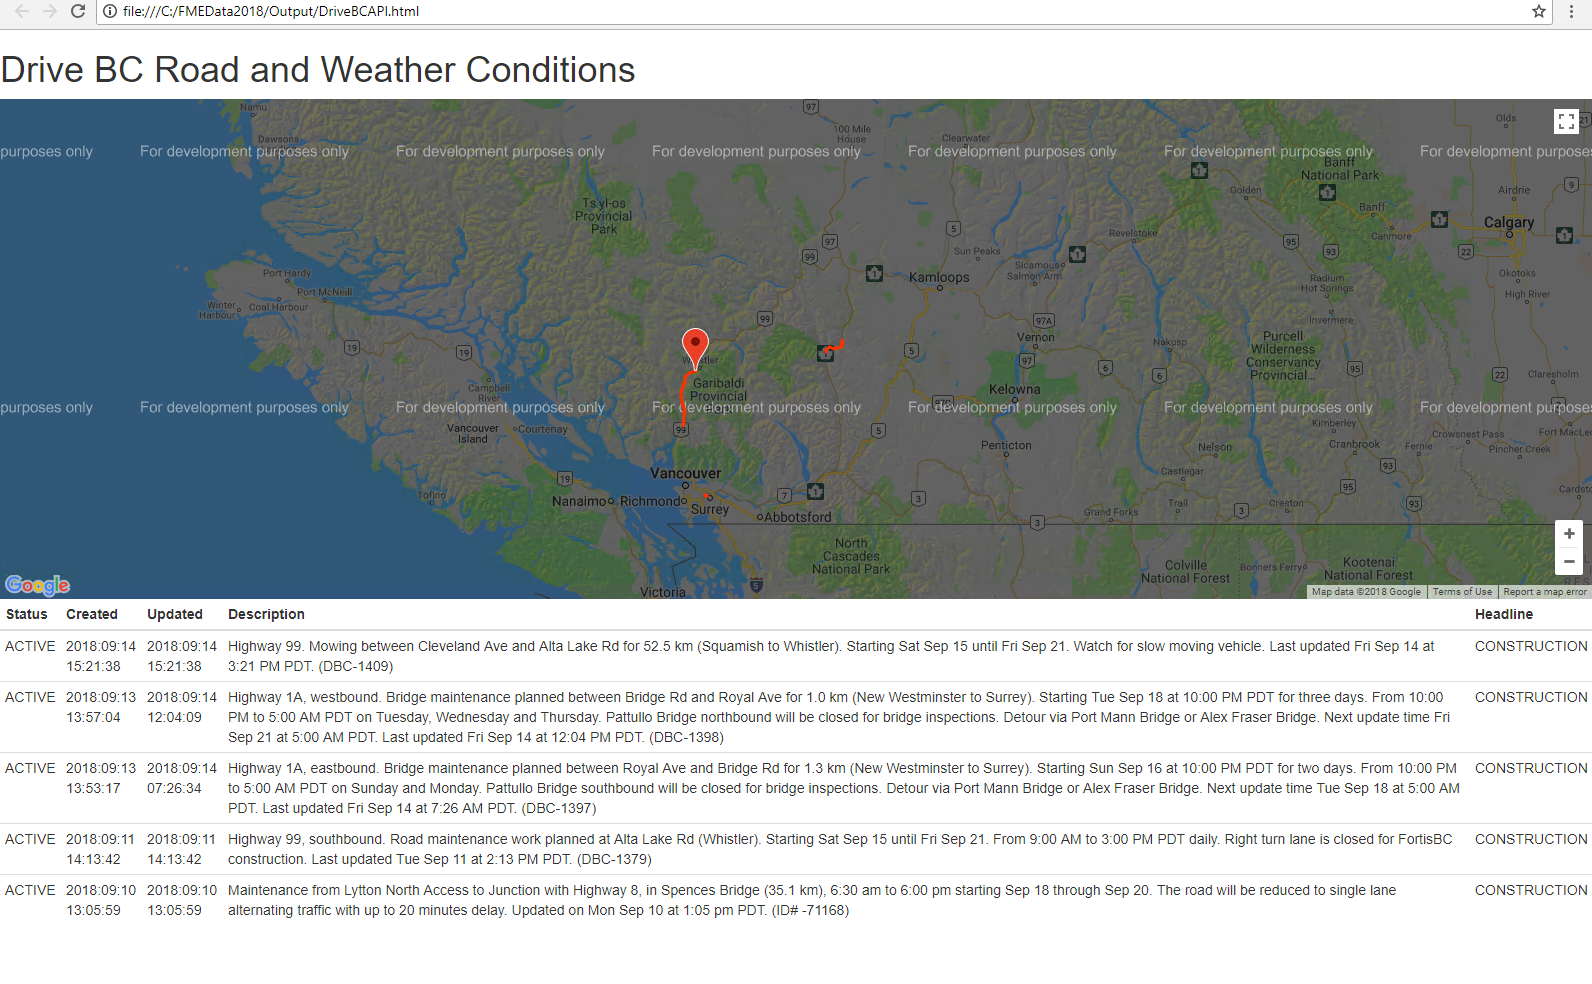
Now, we can save and run the workspace to ensure that everything is working properly. Since, we do not have the API key in place we will receive a message that says that this is for development purposes only. If we added the key, we would have a much more sophisticated page.
This API works with live data, therefore, your results will vary from the screenshot.
28) Upload the Workspace to your Server.
Publish the workspace to FME Server. Upload under to the RESTTraining repository and save the workspace as webapp.bc.roads.fmw. Register the workspace with the Data Download service.
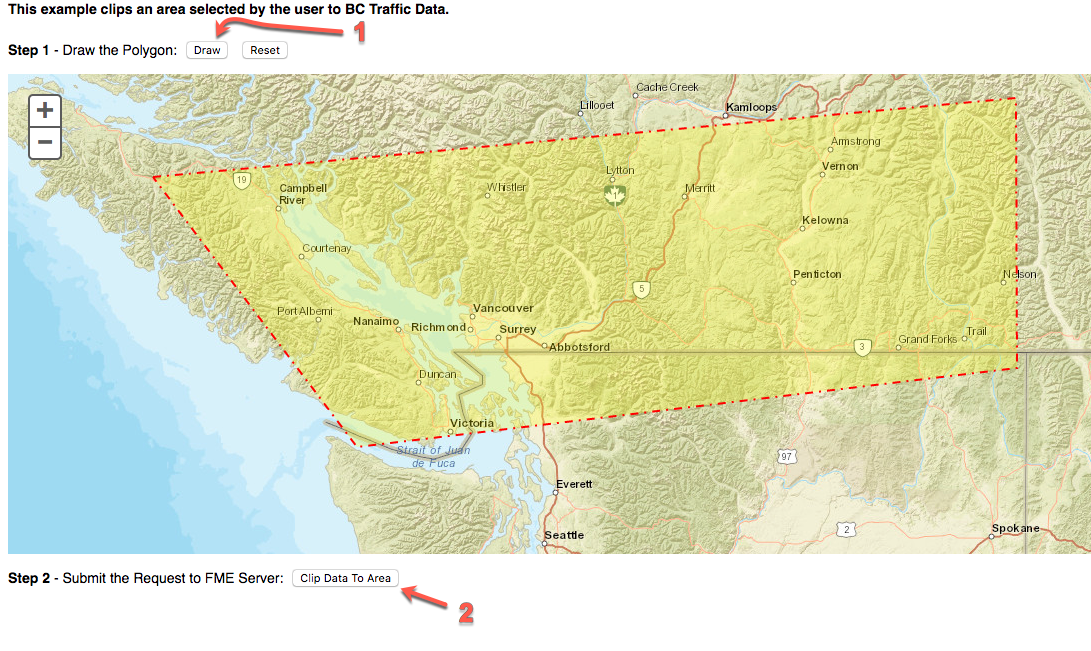
Test the Application
Step 1. Draw the Area (double-click to close the polygon)
Step 2. Select Clip Data to Area
Step 3. Download the DataDownload
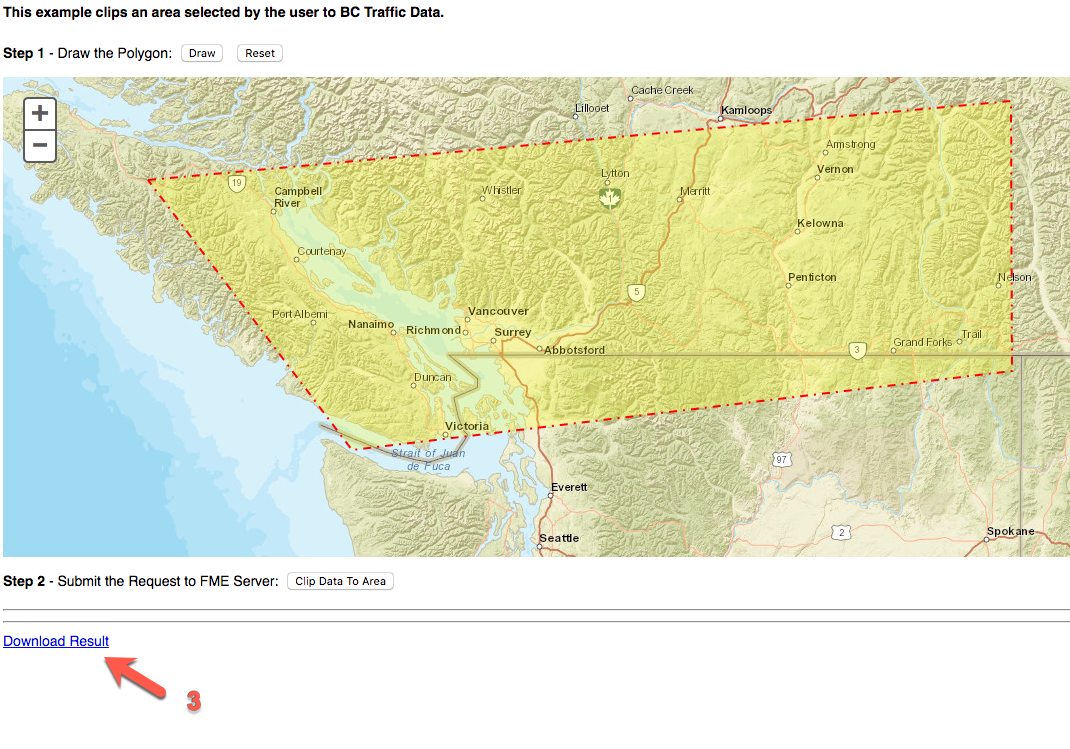
Step 4. Review the File
| CONGRATULATIONS |
By completing this exercise you have learned how to:
|