9.4 Data Visualization using ArcGIS Map
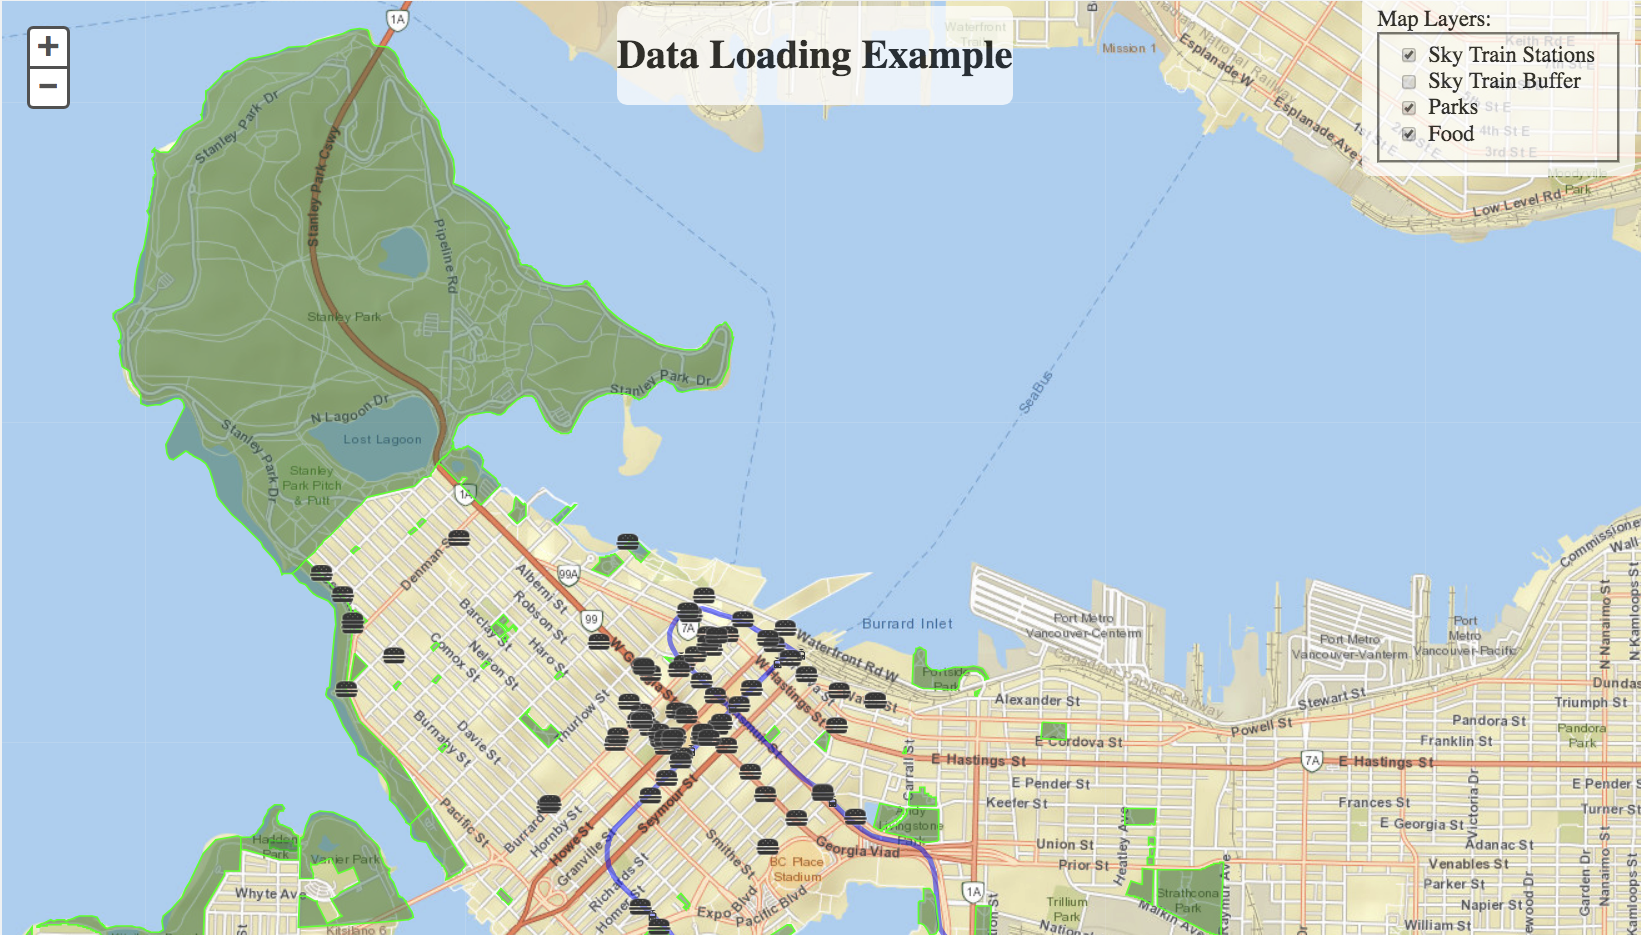
In this example, we will create a map using an Esri basemap and use the Esri JavaScript functions. In this example when a box is checked the a KML layer is loaded. When the box is unchecked, then the layer will be invisible. This is a great example of streaming real-time data to a map. While parks and Skytrain stations may not be updated frequently, this demo may be applied to real-time data. For more information on the Esri JavaScript, please refer to the ArcGIS Developers Documentation.
Please note, the repository that the workspaces are uploaded to will have to have guest permissions. If you need to know how to do this go to Section 8.1 and see Setting Permissions.