| Exercise 3 | Public Art in Parks - Workspace Optimization |
| Data | City Neighborhoods (Google KML) Public Art (Microsoft Excel) Parks (MapInfo Tab) City Orthophoto (GeoTIFF) |
| Overall Goal | Plan out a workspace and determine which parks do not contain public art |
| Demonstrates | Optimizing workspaces and raster processing |
| Start Workspace | C:\FMEData2018\Workspaces\DesktopAdvanced\WorkspaceDesign-Ex3-Begin.fmw |
| End Workspace | C:\FMEData2018\Workspaces\DesktopAdvanced\WorkspaceDesign-Ex3-Complete.fmw |
Our workspace is almost complete; we just need to remove the black borders that were created when the raster was clipped and then write out the data to GeoTIFF. We should also look at making this workspace more efficient.
1) Open Workspace
Start FME Workbench and open WorkspaceDesign-Ex3-Begin.fmw or continue working on the same workspace from the last exercise.
2) Remove Extra Feature Types
When we added the Neighborhood KML back in the first exercise, we added all of the feature types associated with it, but we only ended up using the Neighborhood feature type. All these excess feature types can slow down a workspace. If there is data added to the canvas that isn't used in the translation, it should be removed.
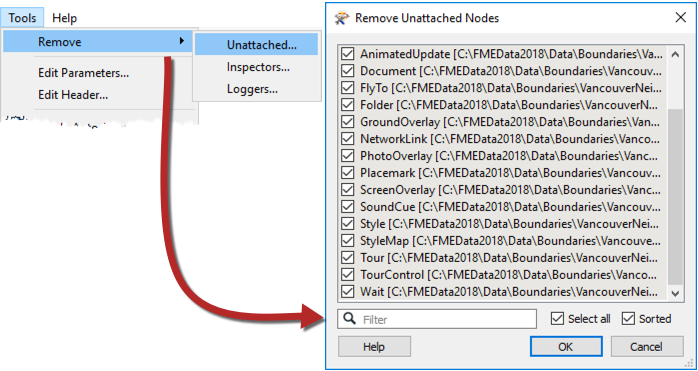
You can manually select all of the excess feature types and remove them, or you can bulk remove them. To bulk remove them select Tools > Remove... > Unattached... on the menubar. Select all and click OK:
NB: Uncheck any nodes that are not the KML Feature Types
| TIP |
| You should also remove excess Loggers and Inspectors once you are done developing your workspace. |
3) Remove No Data
Now that we have removed all the unused data we can continue with our workspace.
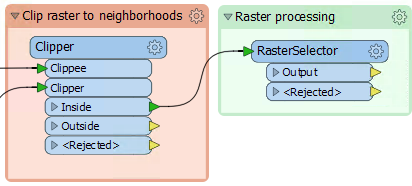
To remove the no data black borders we will need to use two raster specific transformers, the RasterSelector and the RasterBandNoDataSetter. First, add the RasterSelector transformer and connect it to the Clipper:Inside output port. This transformer allows you to select specific bands and palettes to manipulate with other transformers. We will select all of the bands and palettes, so just accept the default parameters:
Next, add the RasterBandNoDataSetter transformer and connect it to the RasterSelector:Output port. In the parameters set the NoData Value to 0. The RasterBandNoDataSetter will remove no data values on the selected bands and palettes:

4) Run the Translation
Rerun the translation and inspect the output from the RasterBandNoDataSetter:
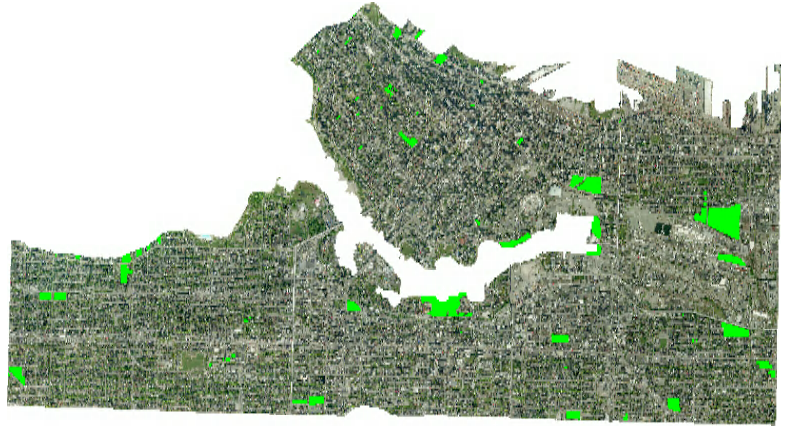
The data looks good, all of the black borders are removed, and it is split up by neighborhood, time to write it out.
5) Write to GeoTIFF
Add a writer to the workspace using the following settings:
| Writer Format | GeoTIFF (Geo-referenced Tagged Image File Format) |
| Writer Dataset | C:\FMEData2018\Output\Training |
| Raster File Definition | Automatic |
Simply click OK to accept the default feature type definition.
Connect the new feature type to the RasterBandNoDataSetter:Output port. Open the writer parameters and set the Raster File Name to the attribute NeighborhoodName. This will fanout our rasters so that each neighborhood will be written out as a separate GeoTIFF:

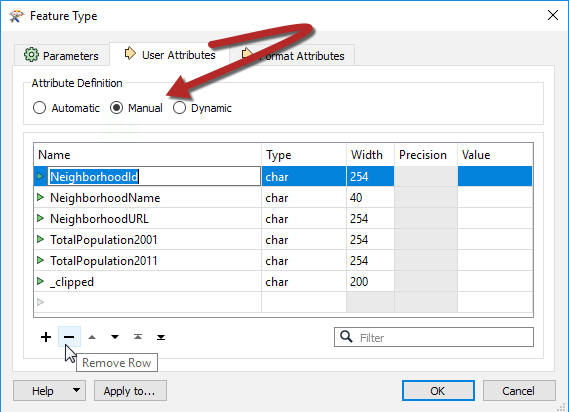
While we are inspecting the parameters, we should also remove some of the attributes since we don't need to write them all out. Switch the tab to User Attributes then select Manual for Attribute Definition. Now all the attribute can be edited. Select all rows, then click the minus button at the bottom and remove all of the attributes:
6) Write to Excel
Just as we are ready to press the run button for one final time, we were asked to provide an Excel spreadsheet to accompany the park GeoTIFF files. This is easy to do since the workspace already creates this data, we just need to write it out.
Add an Excel Writer to the canvas:
| Writer Format | Microsoft Excel |
| Writer Dataset | C:\FMEData2018\Output\Training\Neighborhoods.xlsx |
| Sheet Definition | Automatic |
Once you've added it to the canvas, connect it to the Tester:Passed output port. Then go into the parameters and set the Sheet Name to NeighbourhoodName:

Then switch to the User Attributes tab and set the Attribute Definition to Manual. Remove the _overlaps attribute that was created by the PointOnAreaOverlayer, but keep the rest:

7) Run the translation
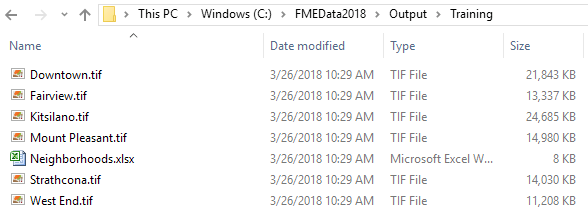
Finally, run the translation. In the Output\Training folder, there will be a GeoTIFF for each of the neighborhood rasters, as well as an Excel file with each neighborhood on separate sheets:
| CONGRATULATIONS |
By completing this exercise, you have learned how to:
|